Обучение
Project Analytics
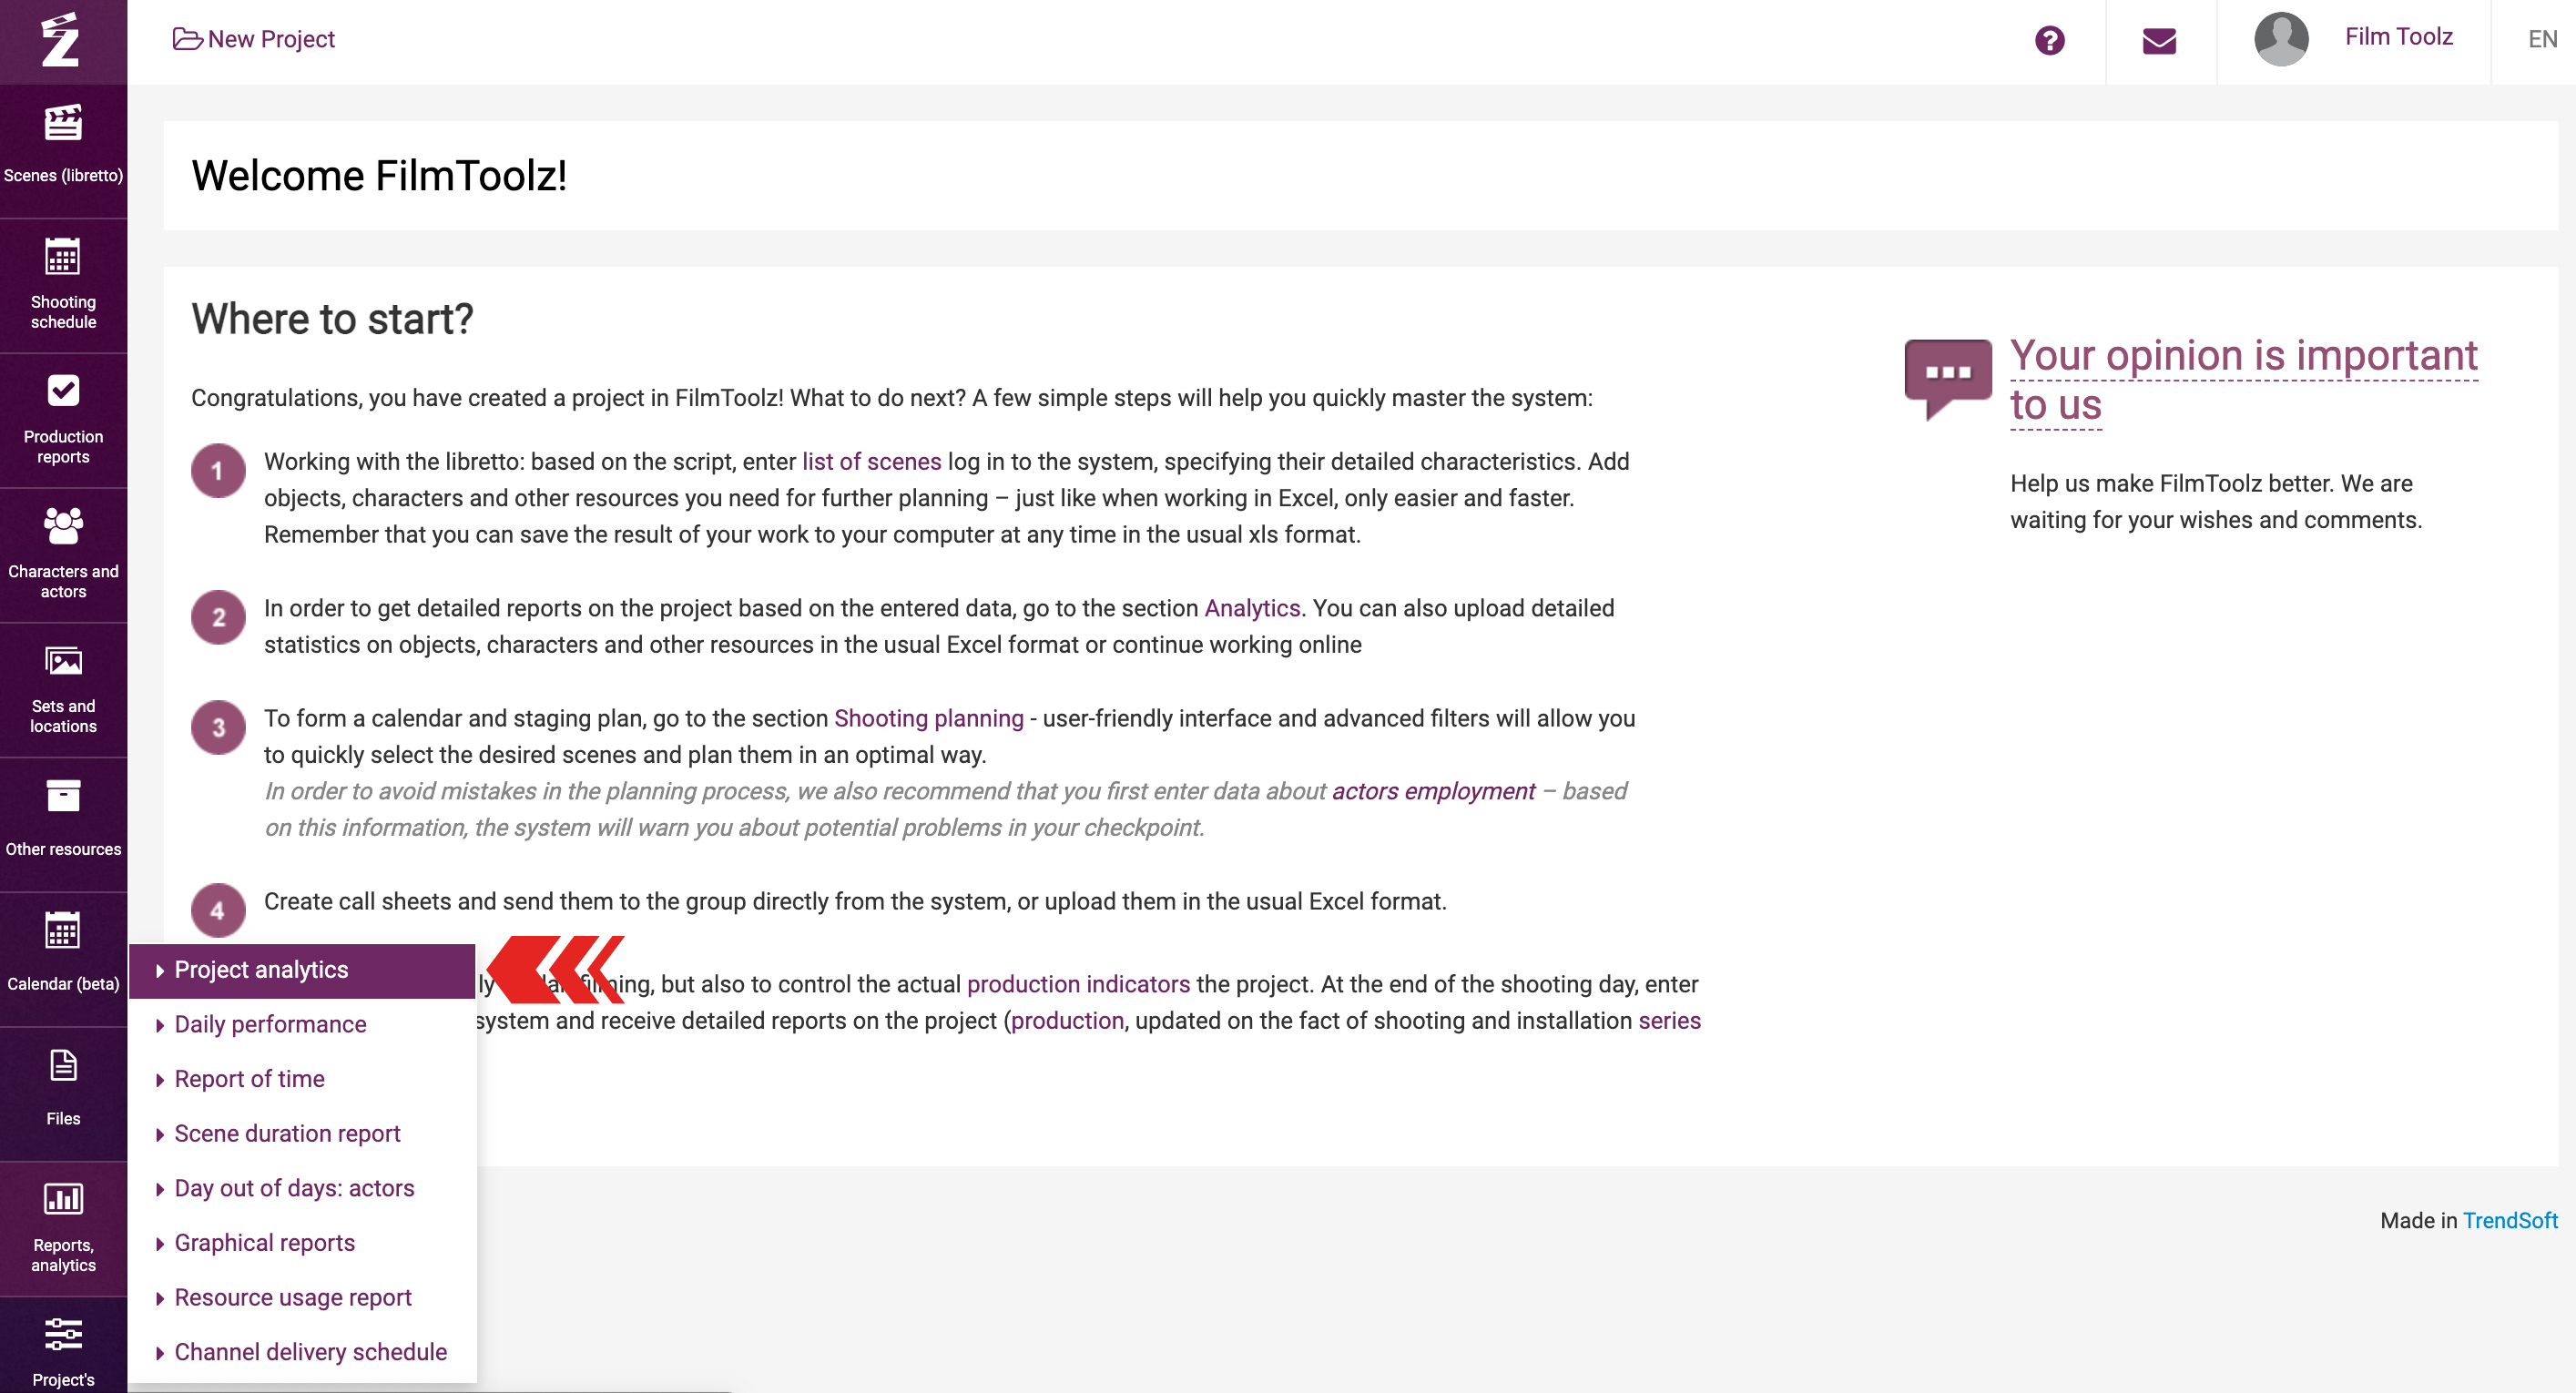
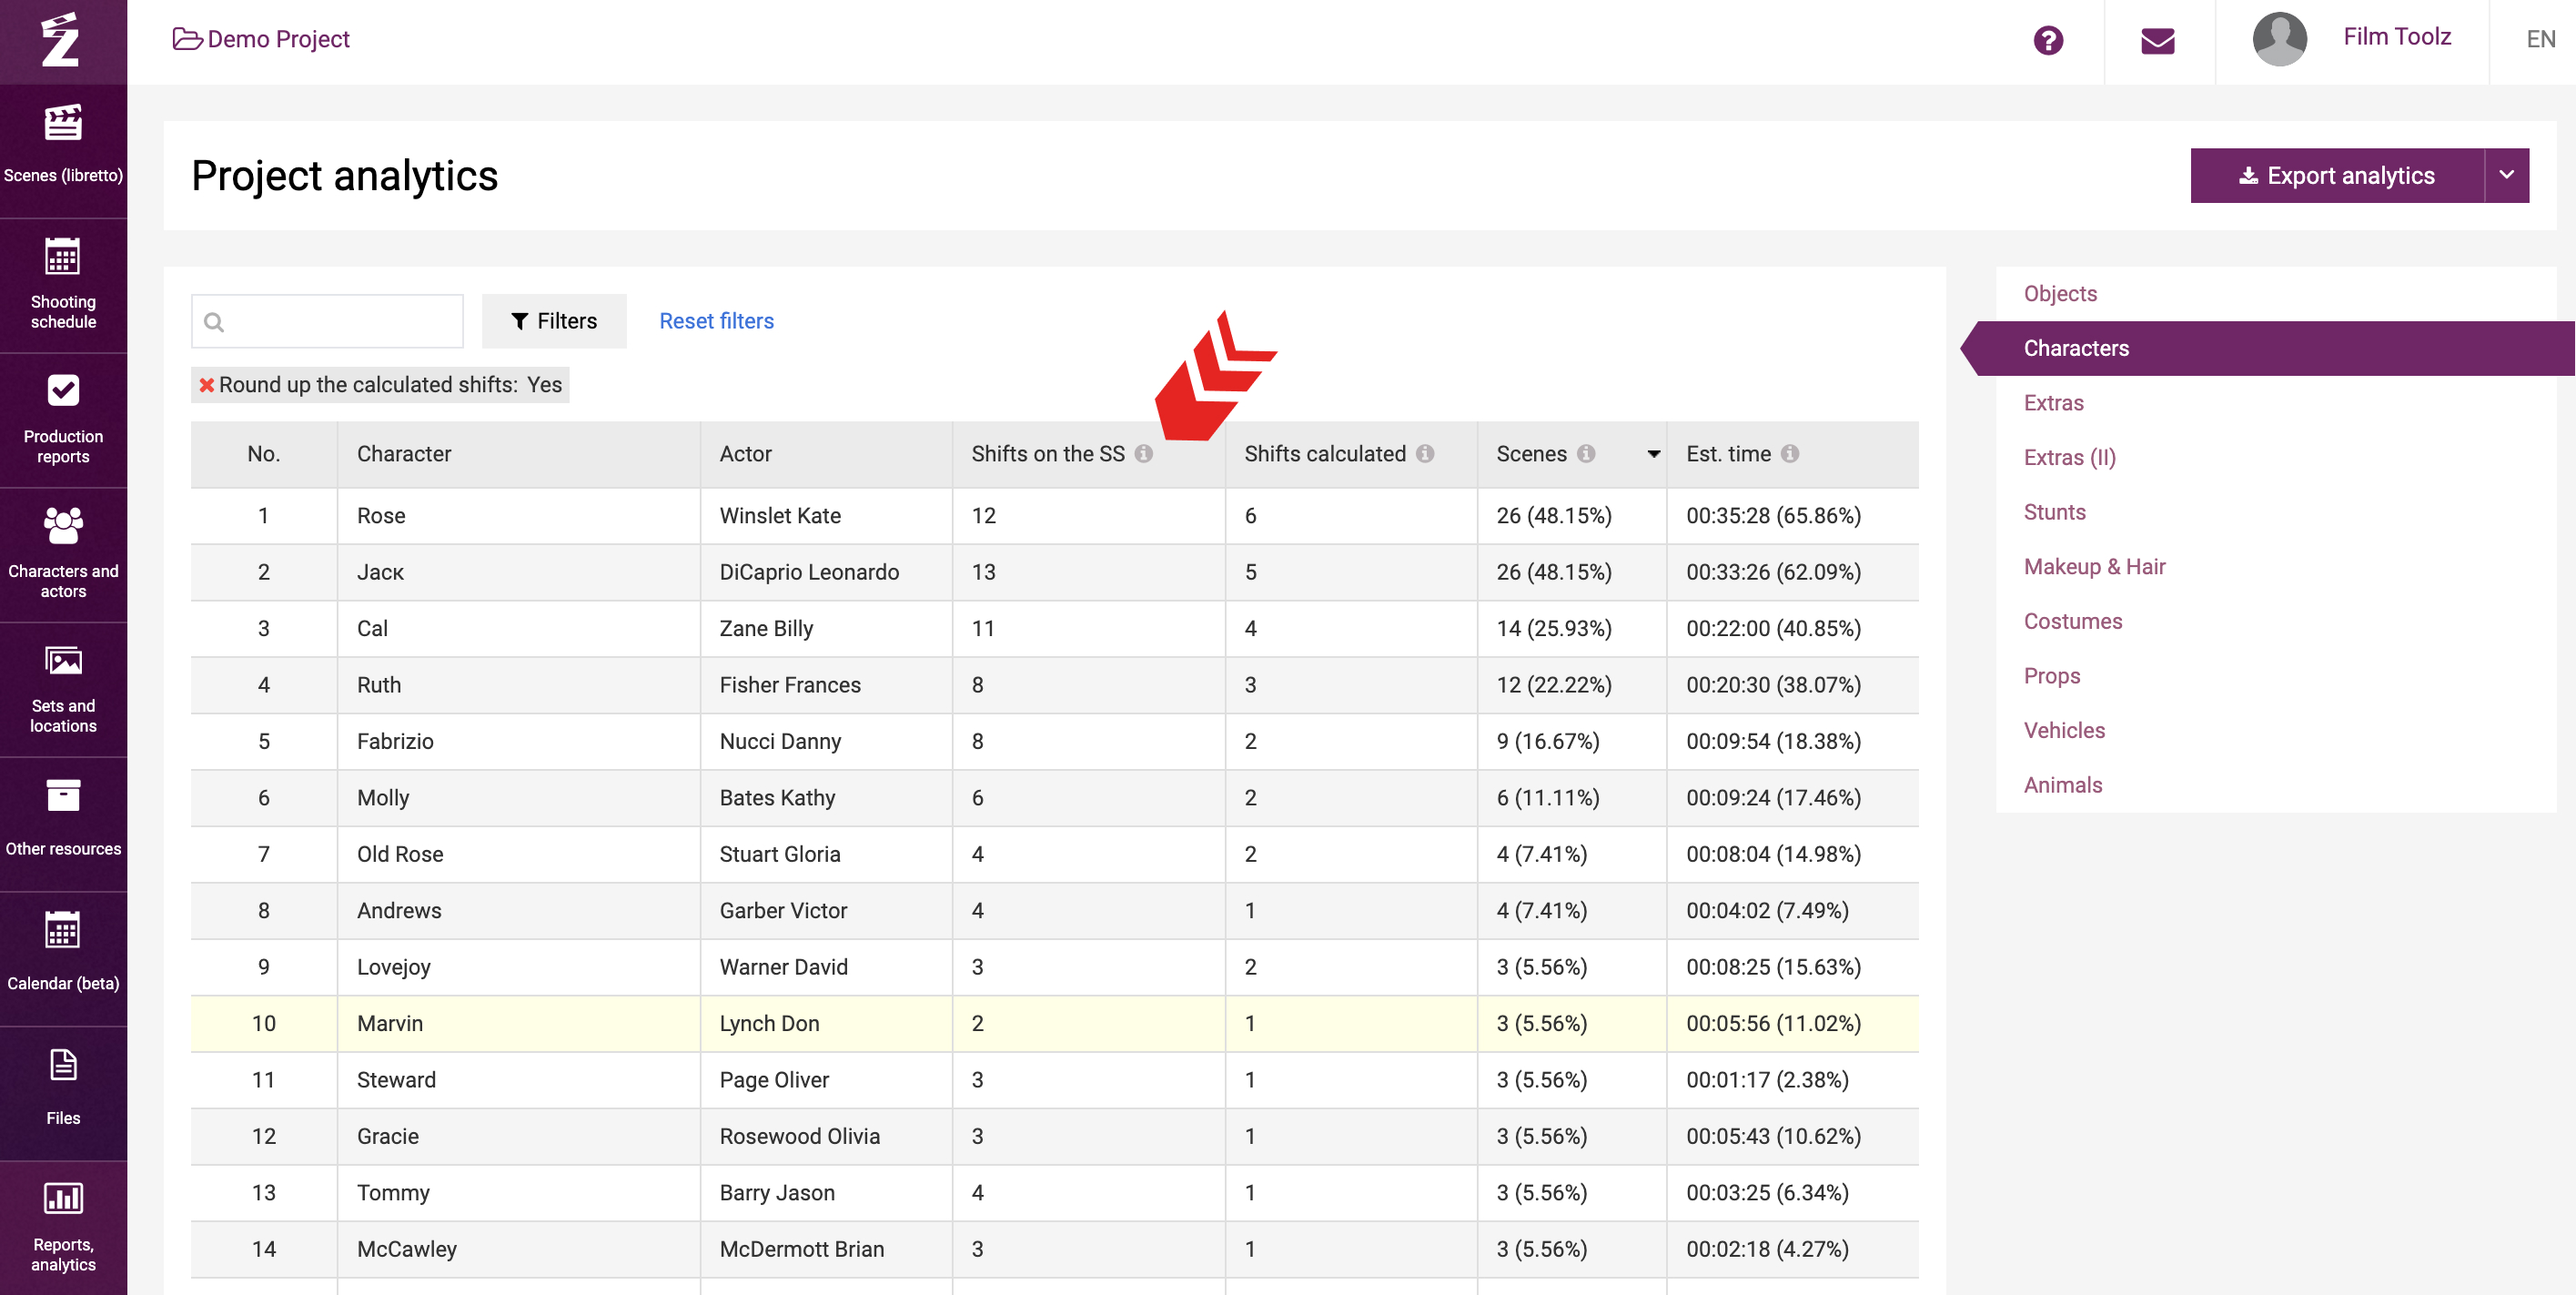
One of the key tools used by first assistant director and executive producer is the “Project Analytics” report containing detailed statistics on the sets, characters, and all other elements employed in the script. To access the report page, mouse over the “Reports, analytics” menu and select “Project analytics”.
The column to the right lists the elements employed in the project. Select the required category to view the report for the relevant element.
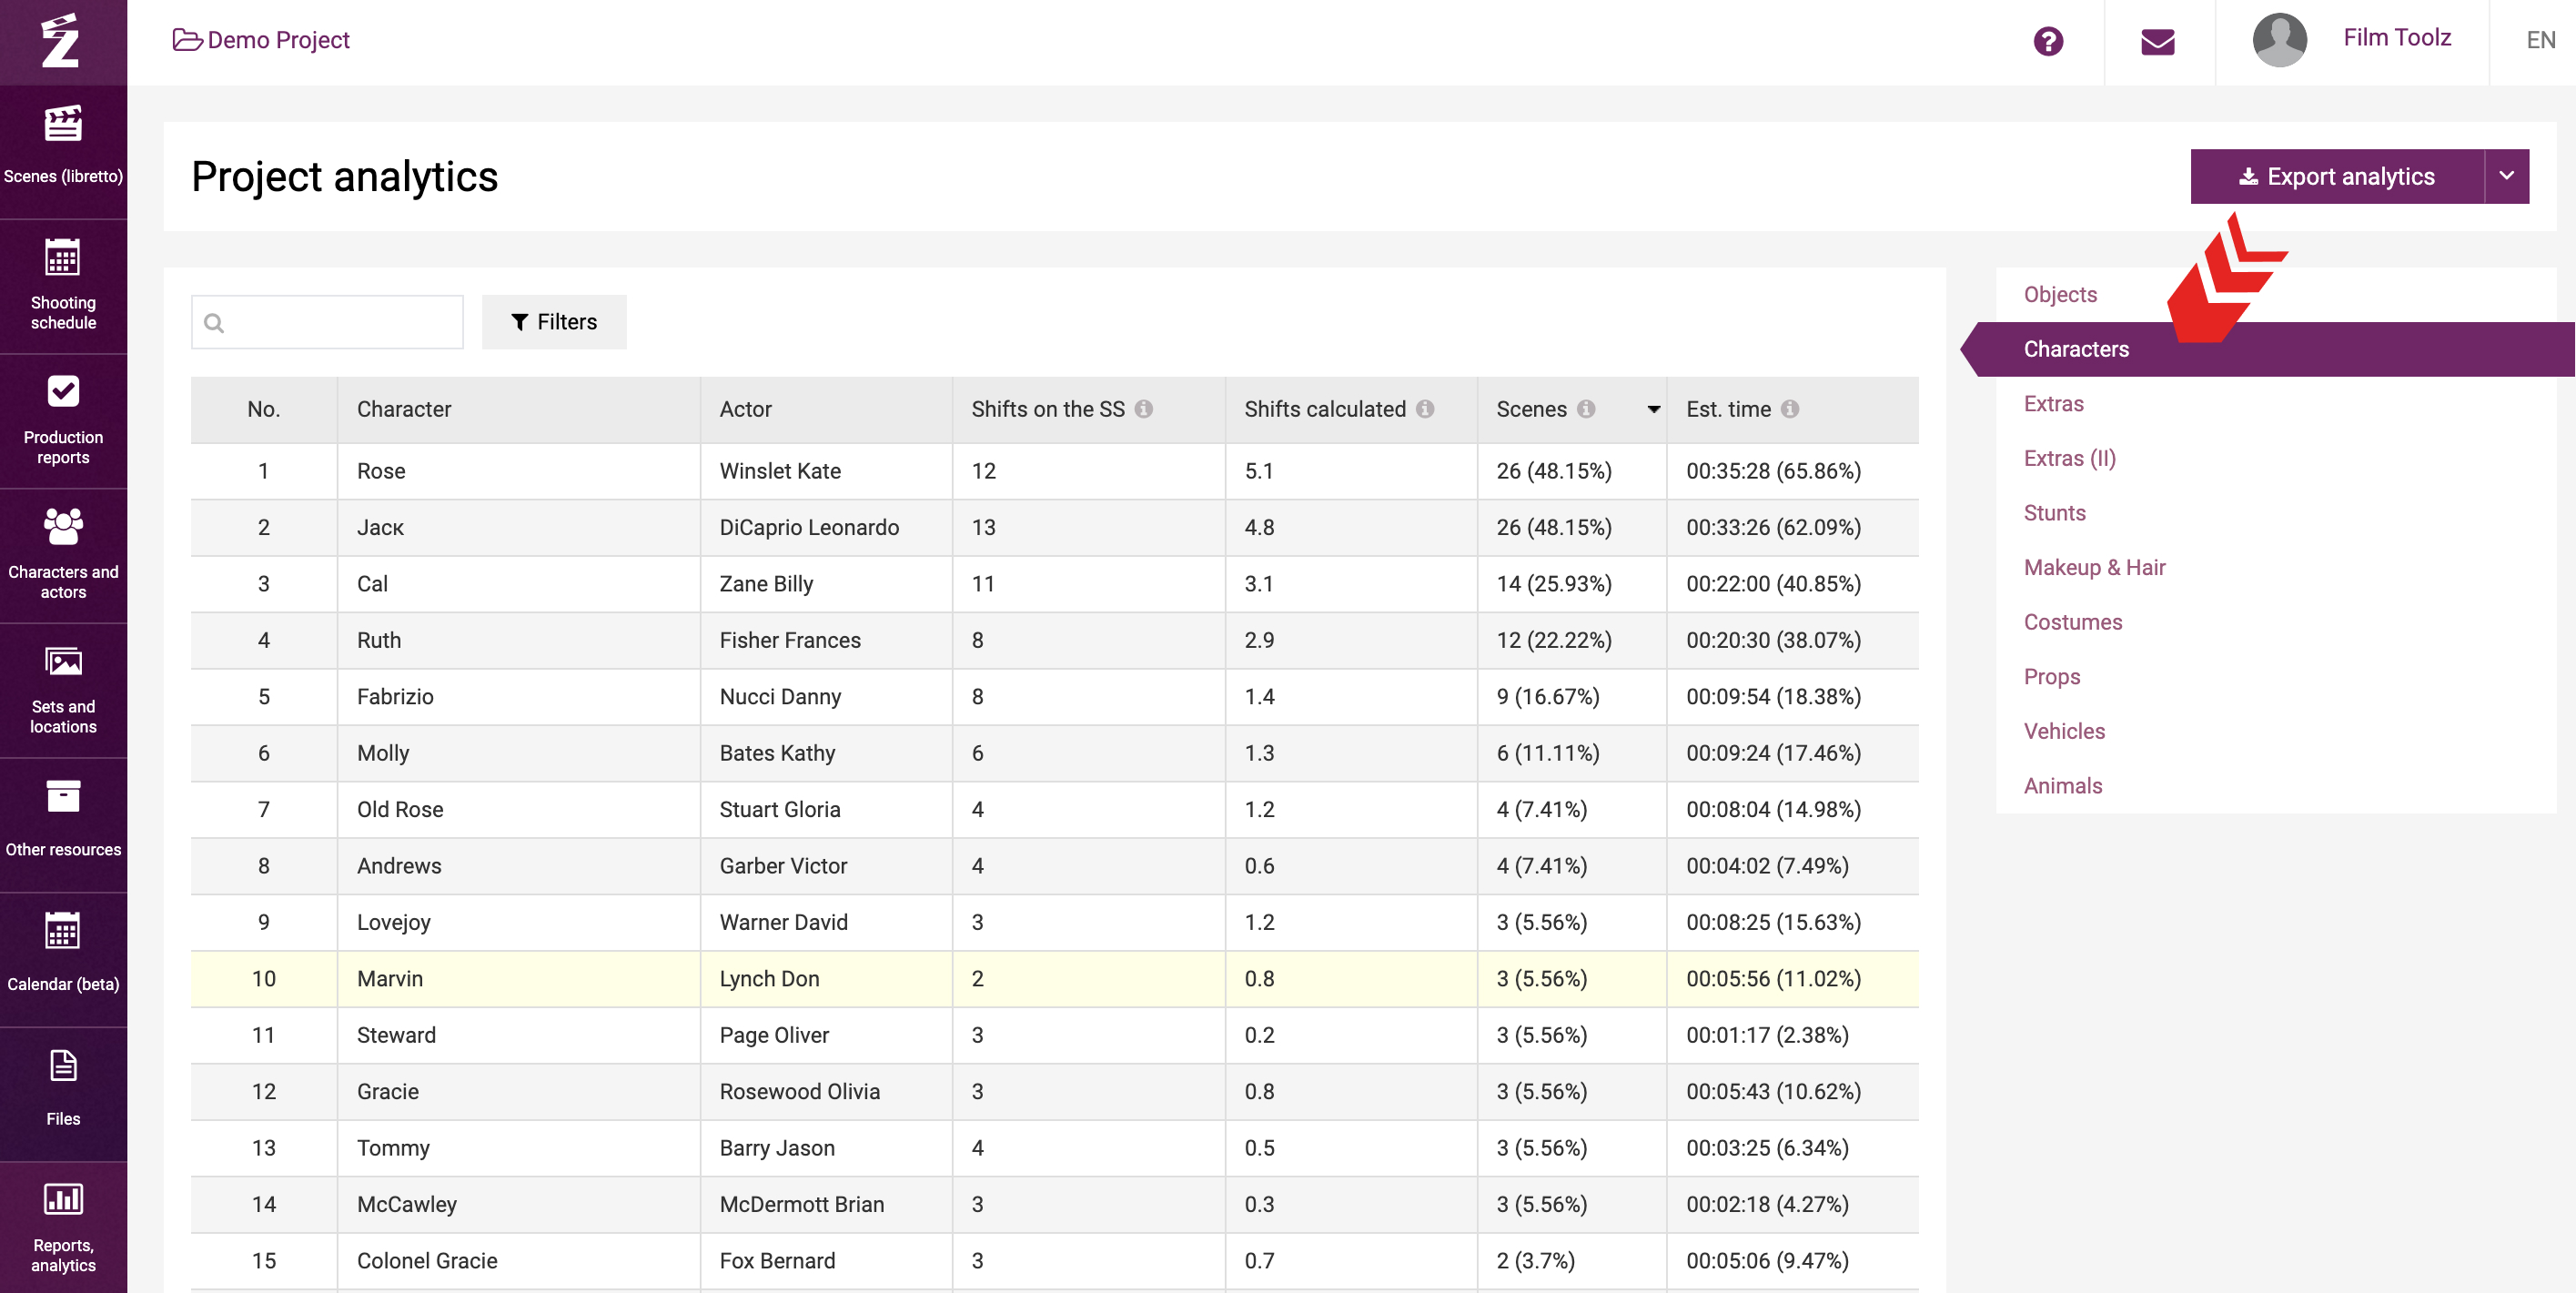
The table itself contains data on the total number of scenes involving this element, their screen time, scheduled and actual number of shooting days under the shooting schedule.
The column “Estimated qty of shoot days” shows the estimated quantity of shooting days calculated by the system automatically by dividing the estimated screen time of scenes by the estimated output specified in the project settings. For instance, if the estimated screen time of the scenes featuring an actor is 22 minutes, and the project estimated output is 7 minutes, then the estimated quantity of shooting days featuring this actor shall be 22/7 = 3.1.
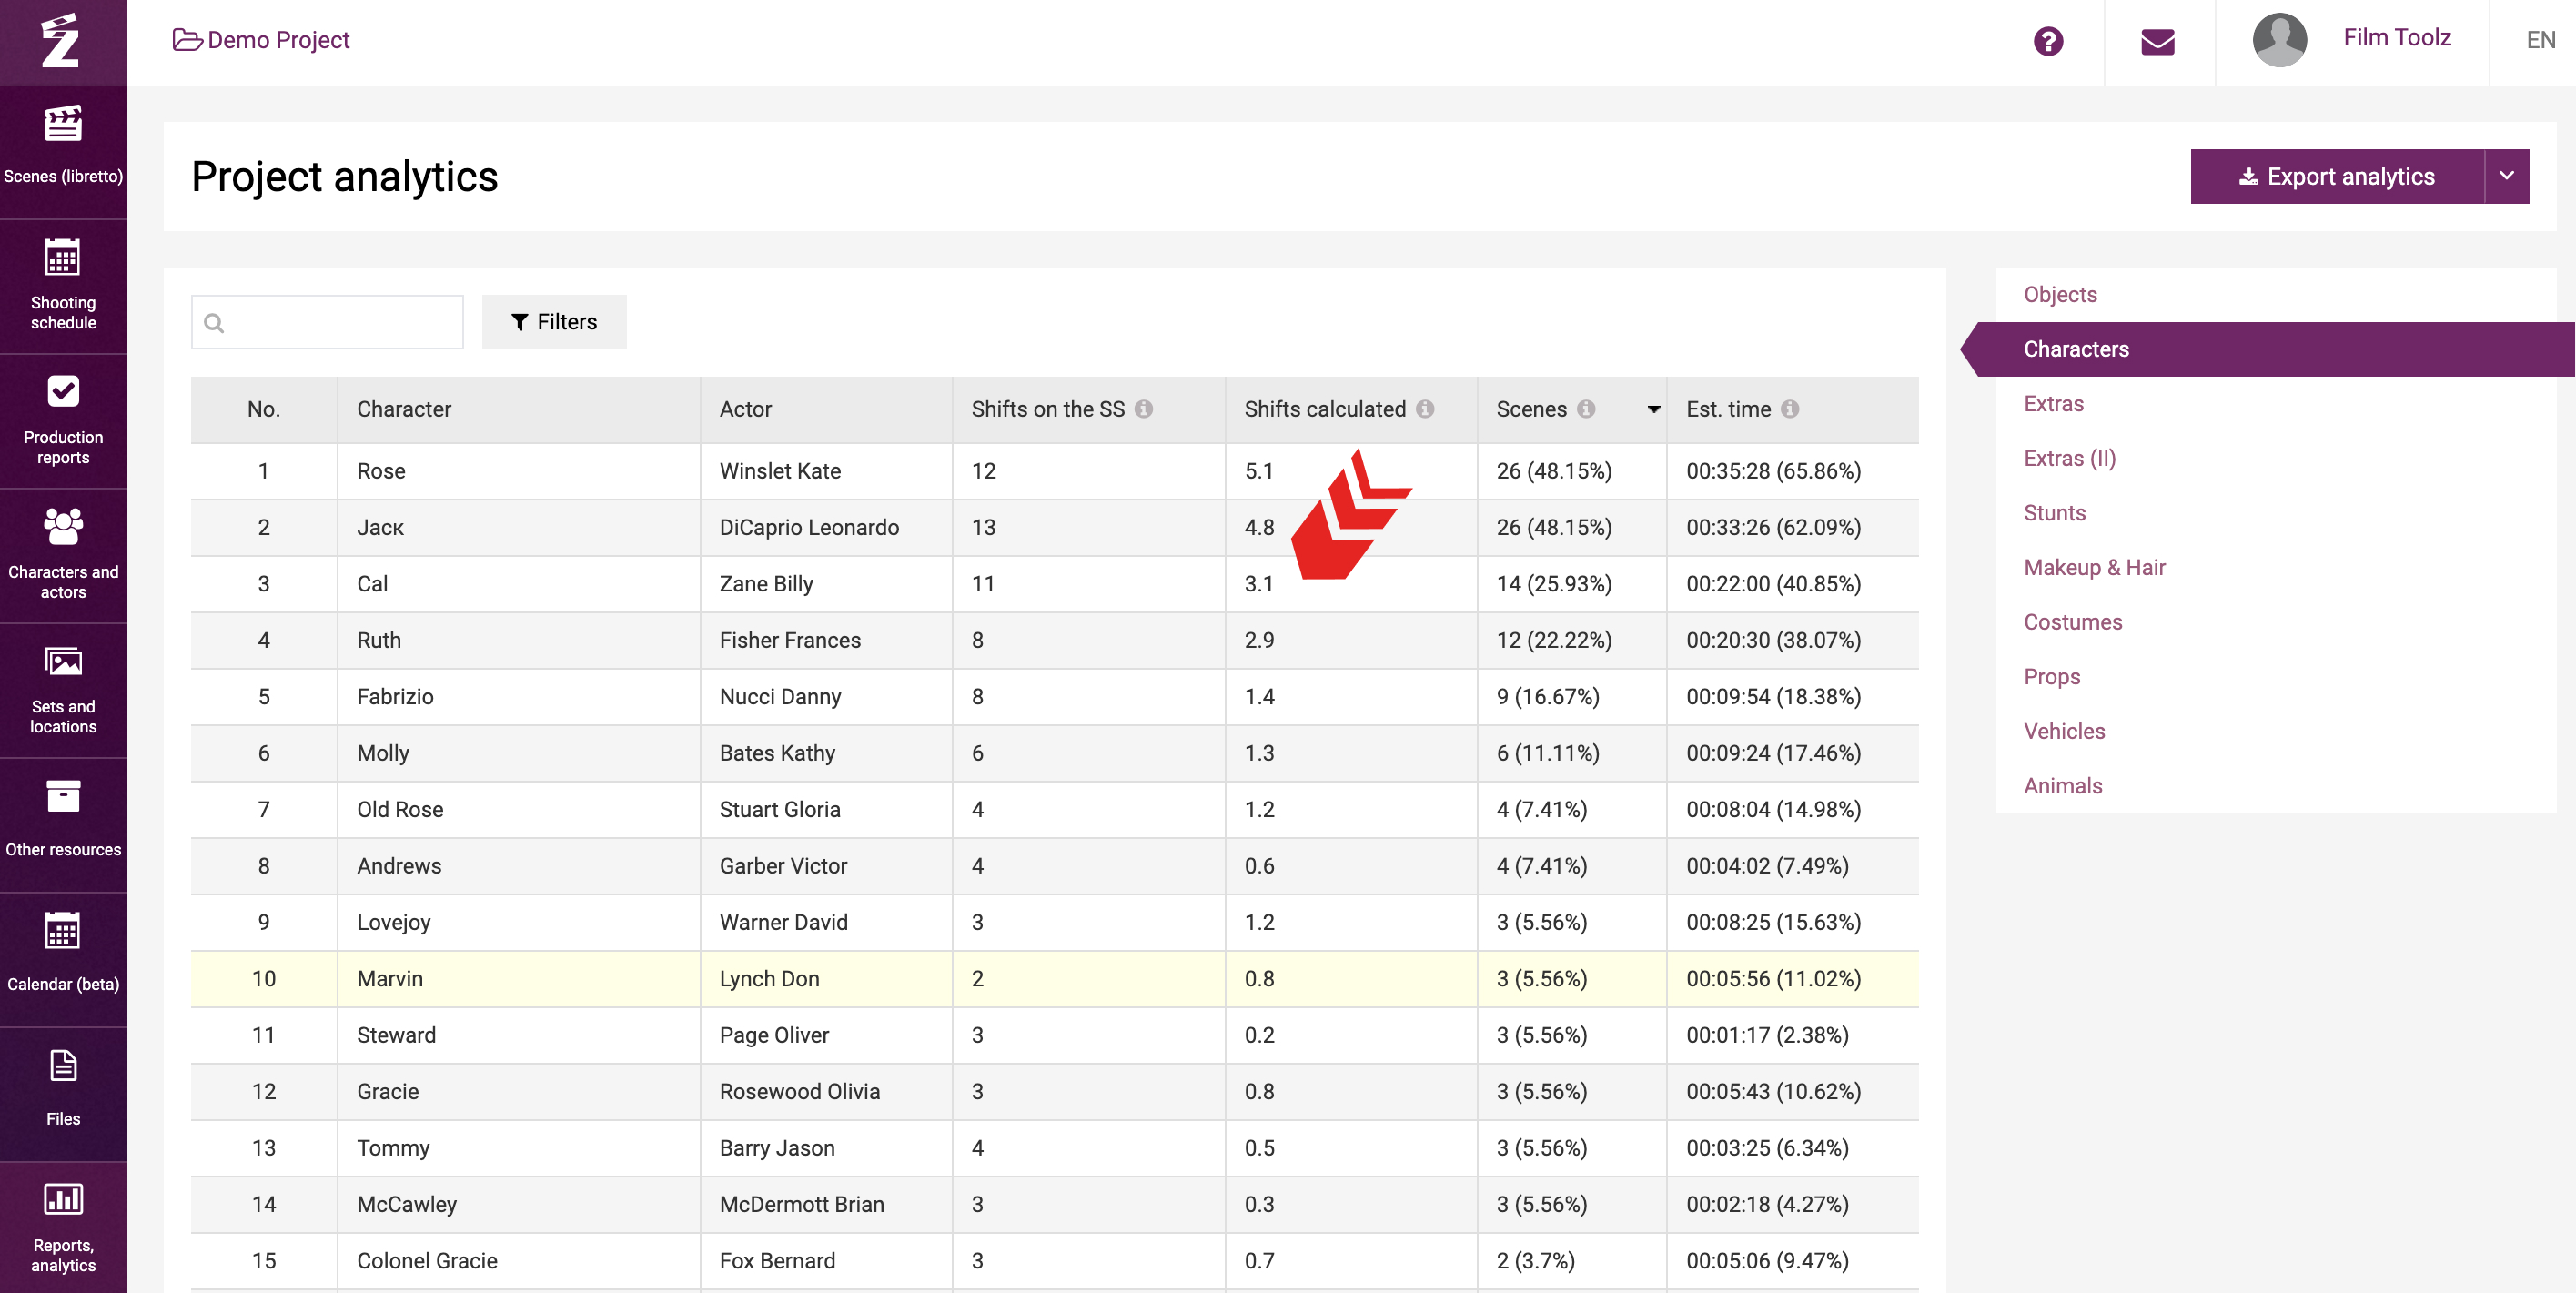
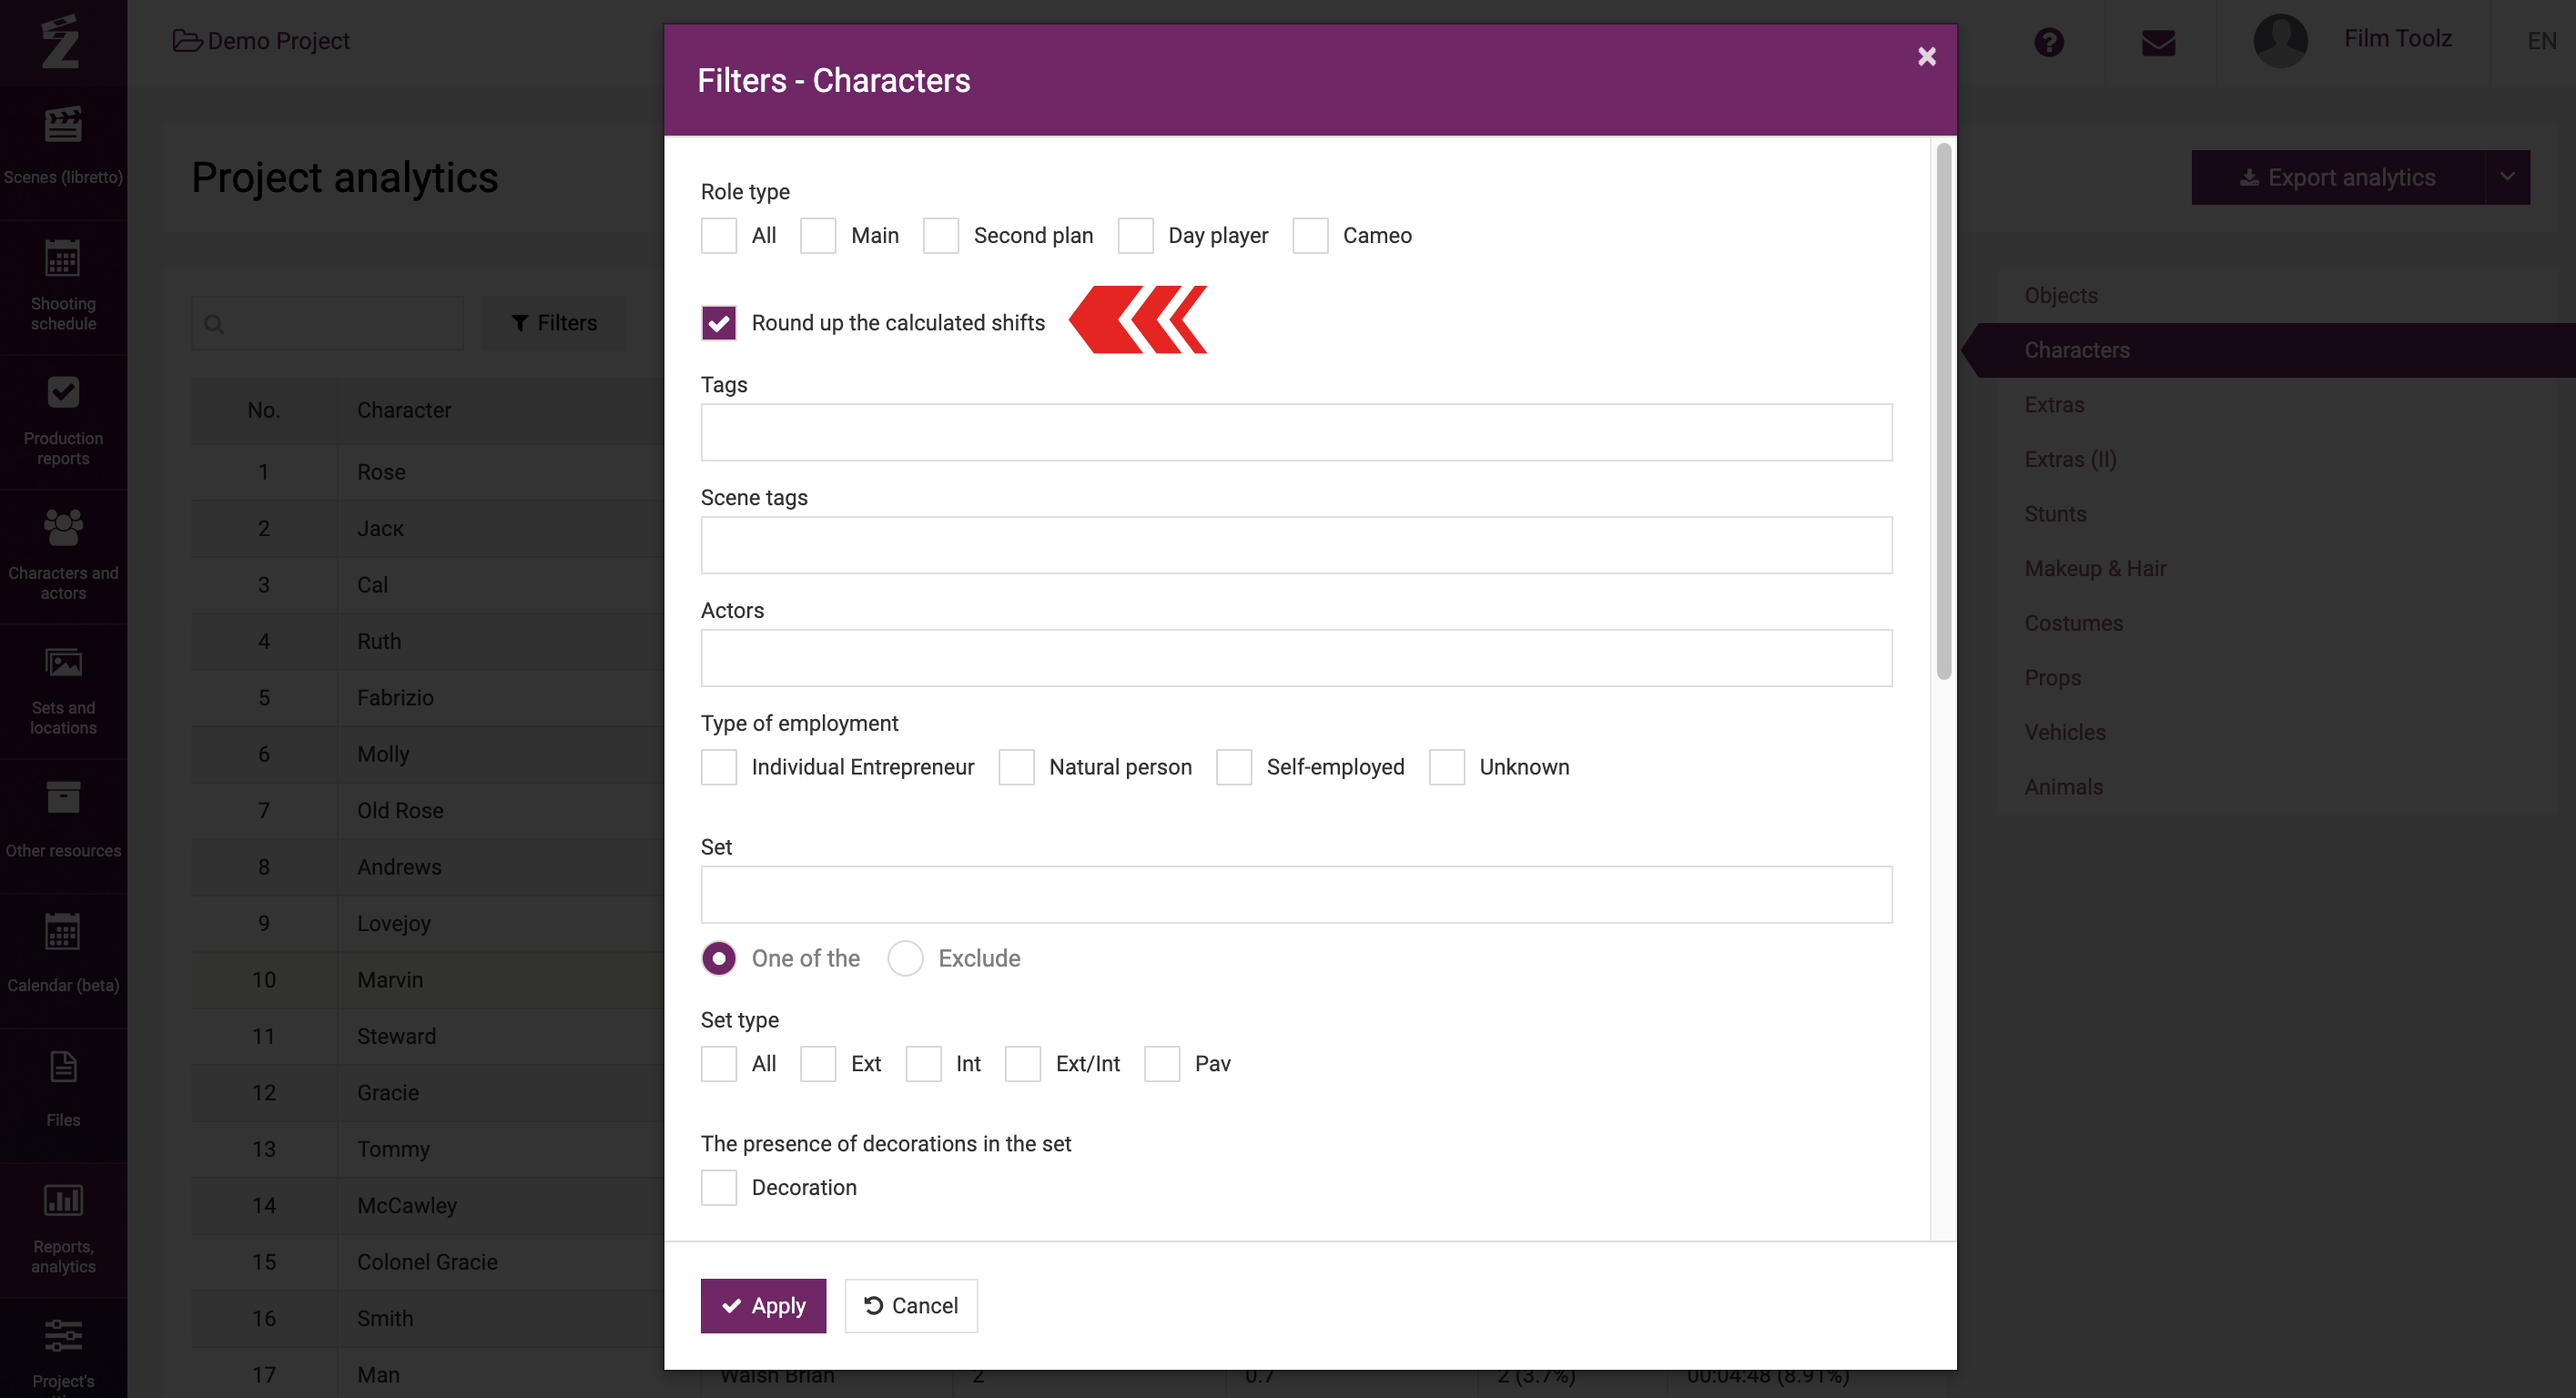
Using filters, you can round this indicator by putting the respective tick at the top of the table. All values will be rounded up. This indicator will be used to estimate the provisional budget of the project at the stage when no version of the shooting schedule is available yet.
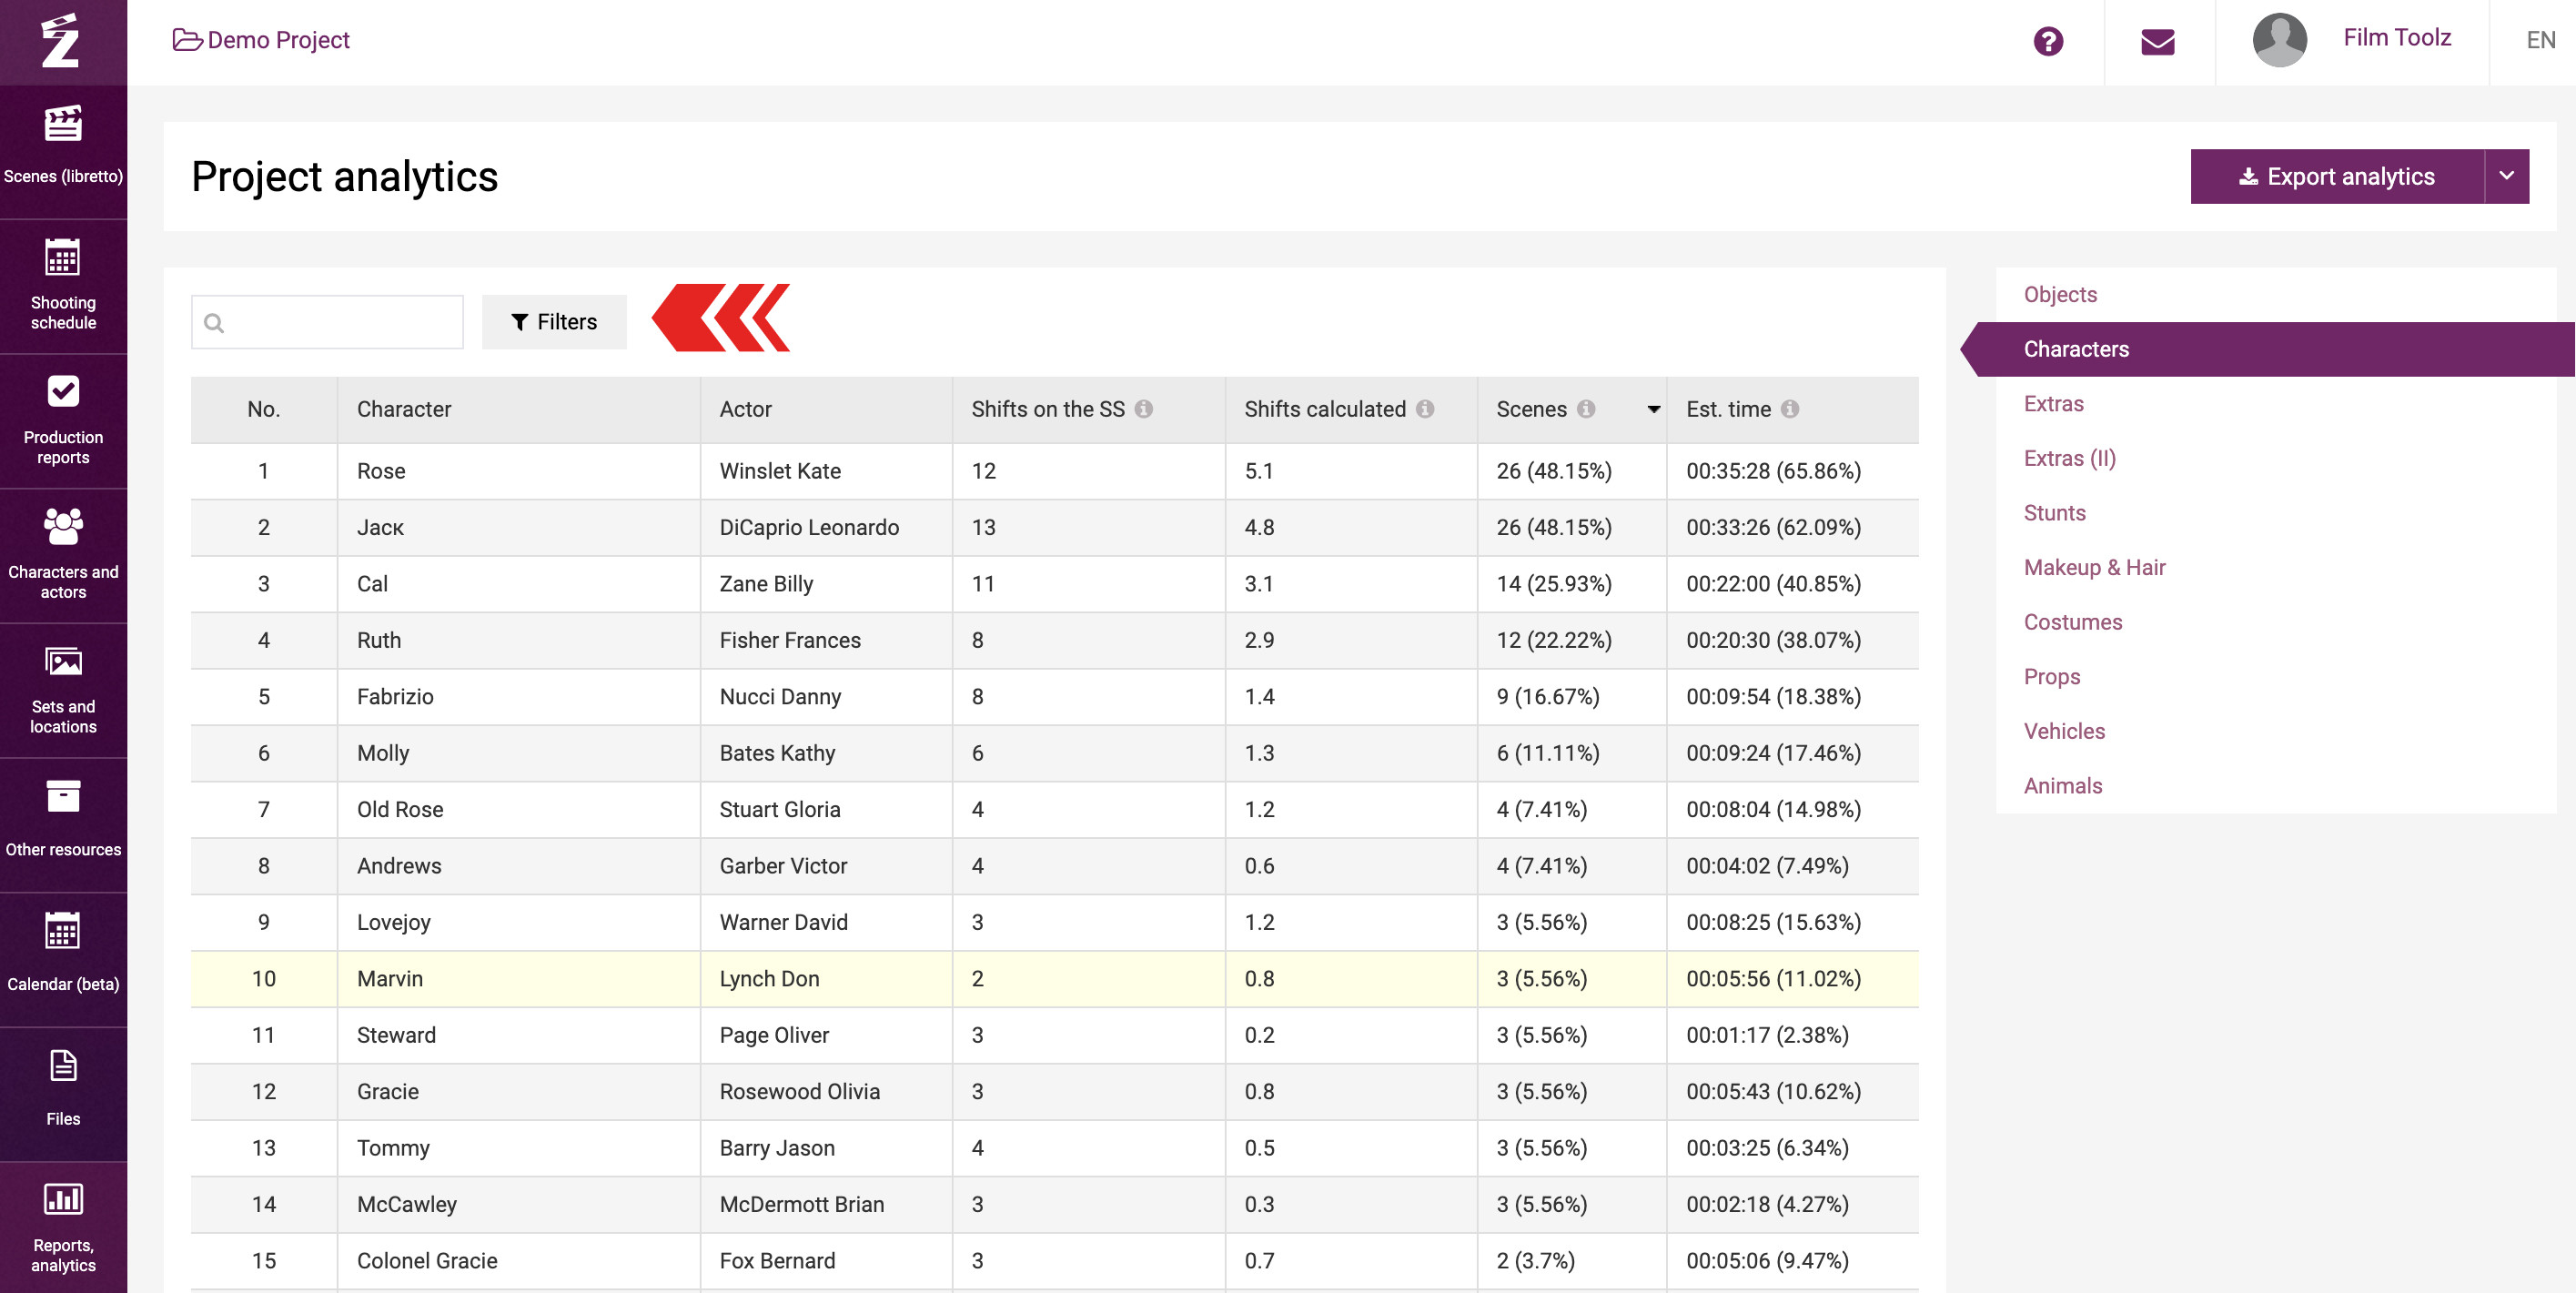
The “Scenes” column displays the number of scenes employing the relevant character, element, or set in the project. The same information is shown as a percentage of all project scenes in brackets. 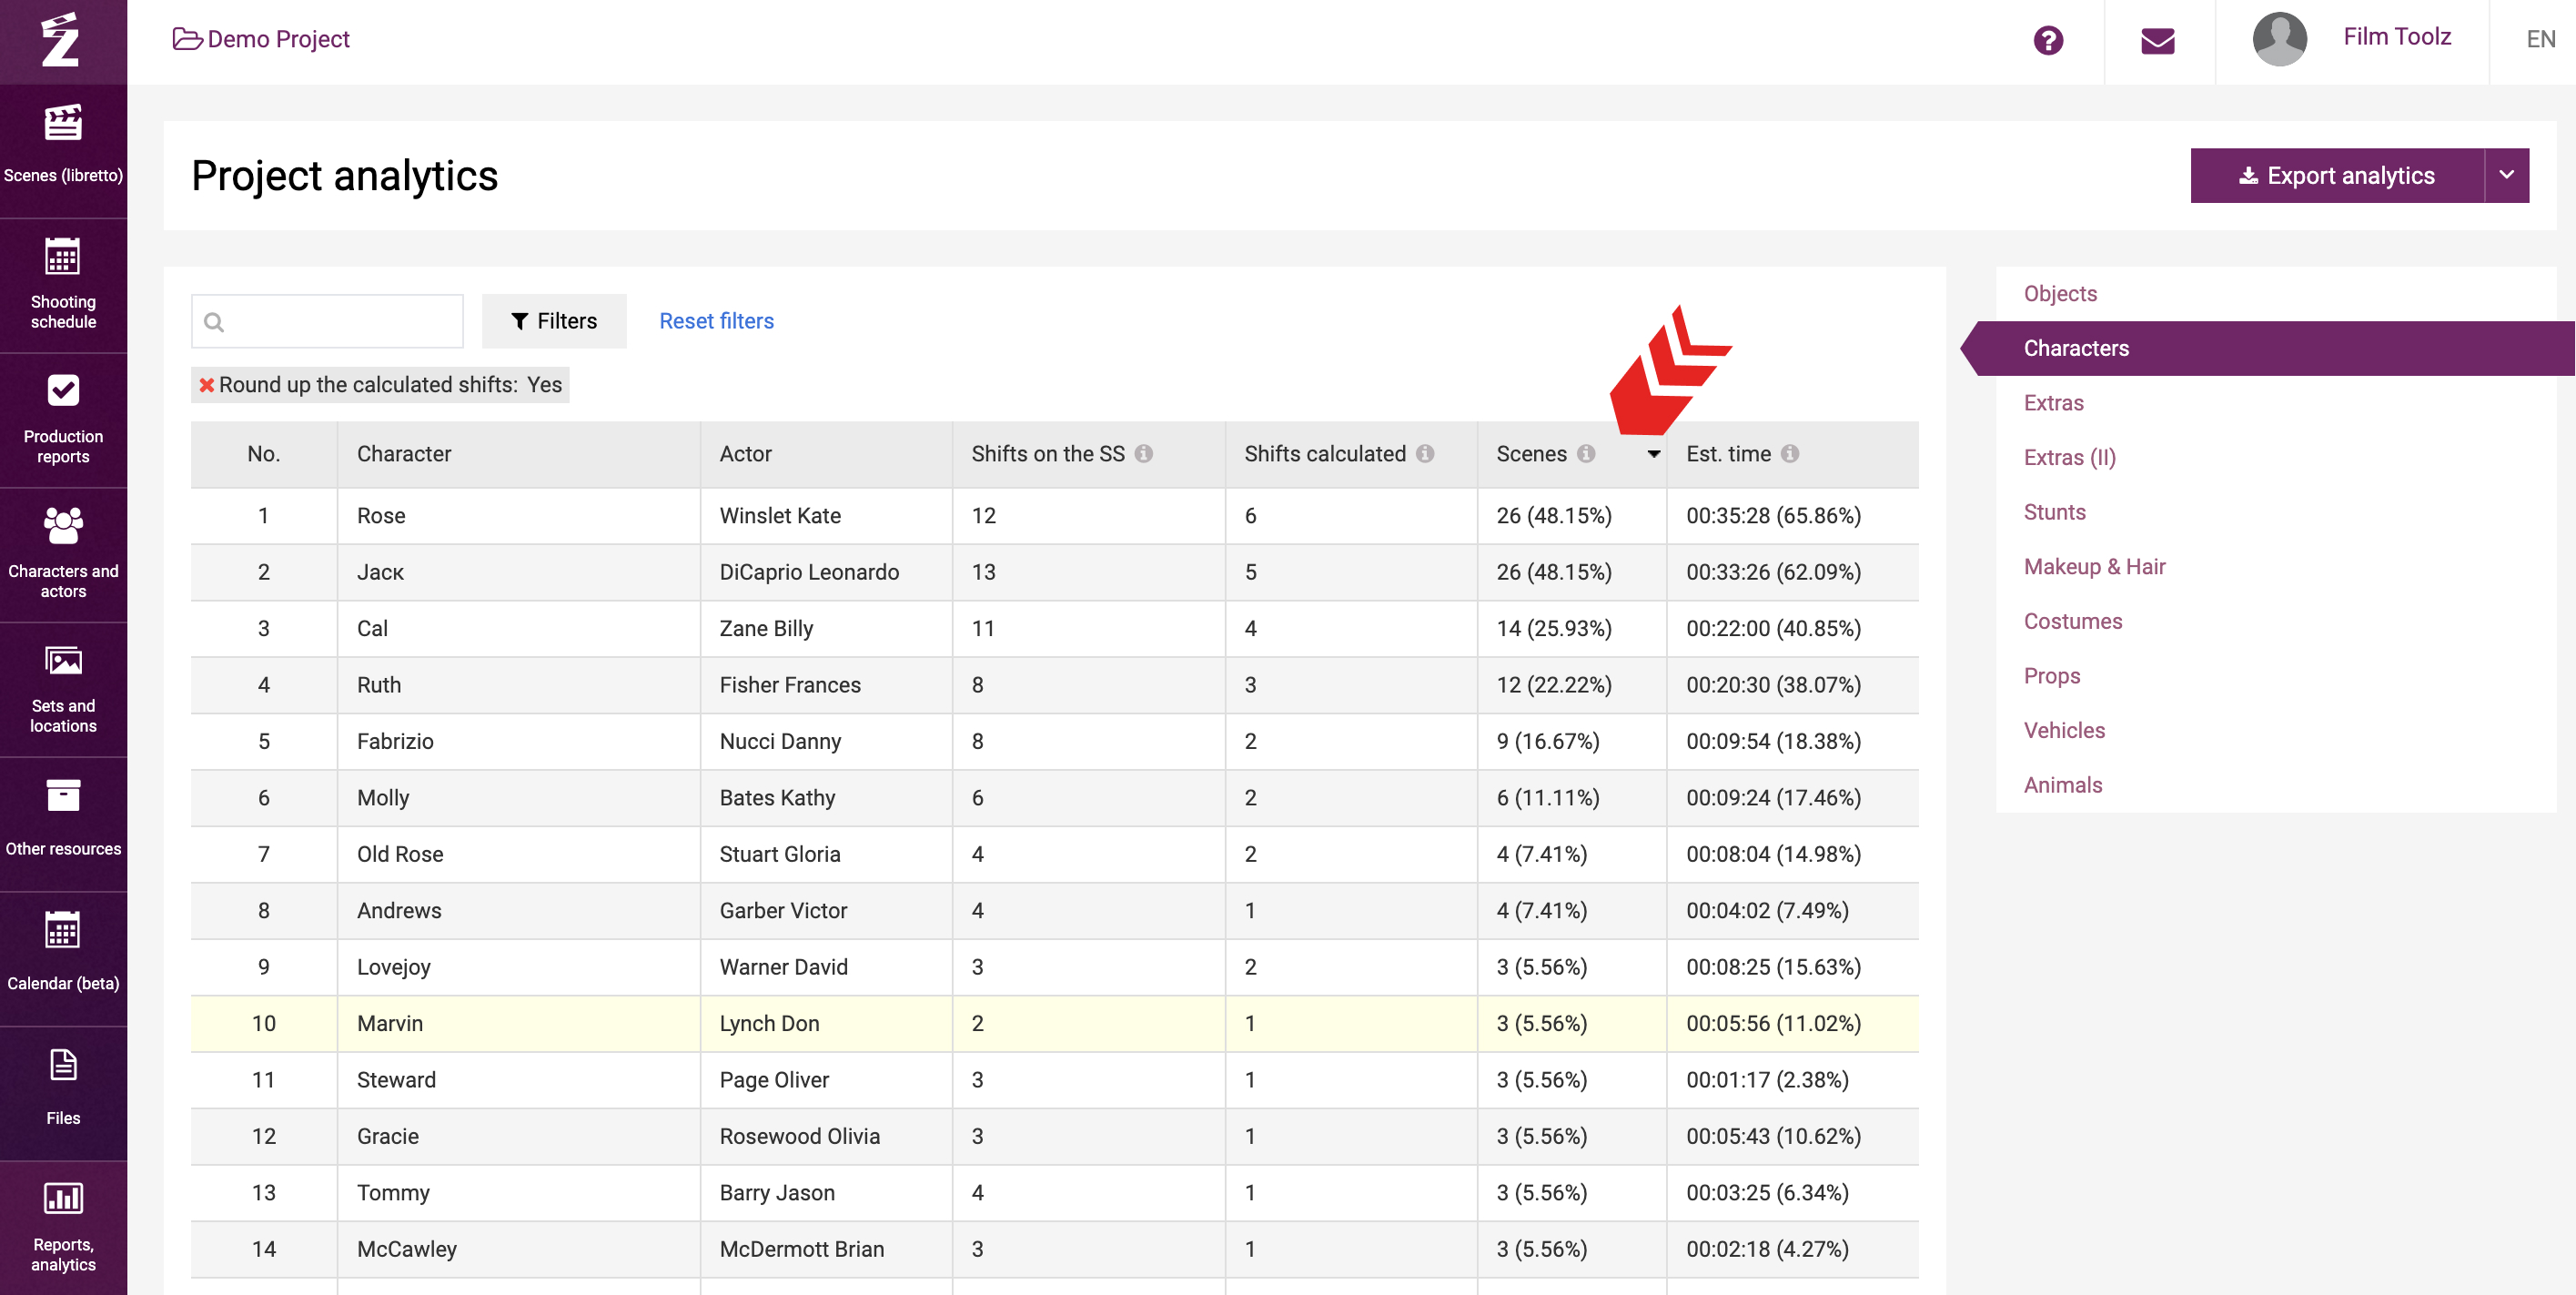
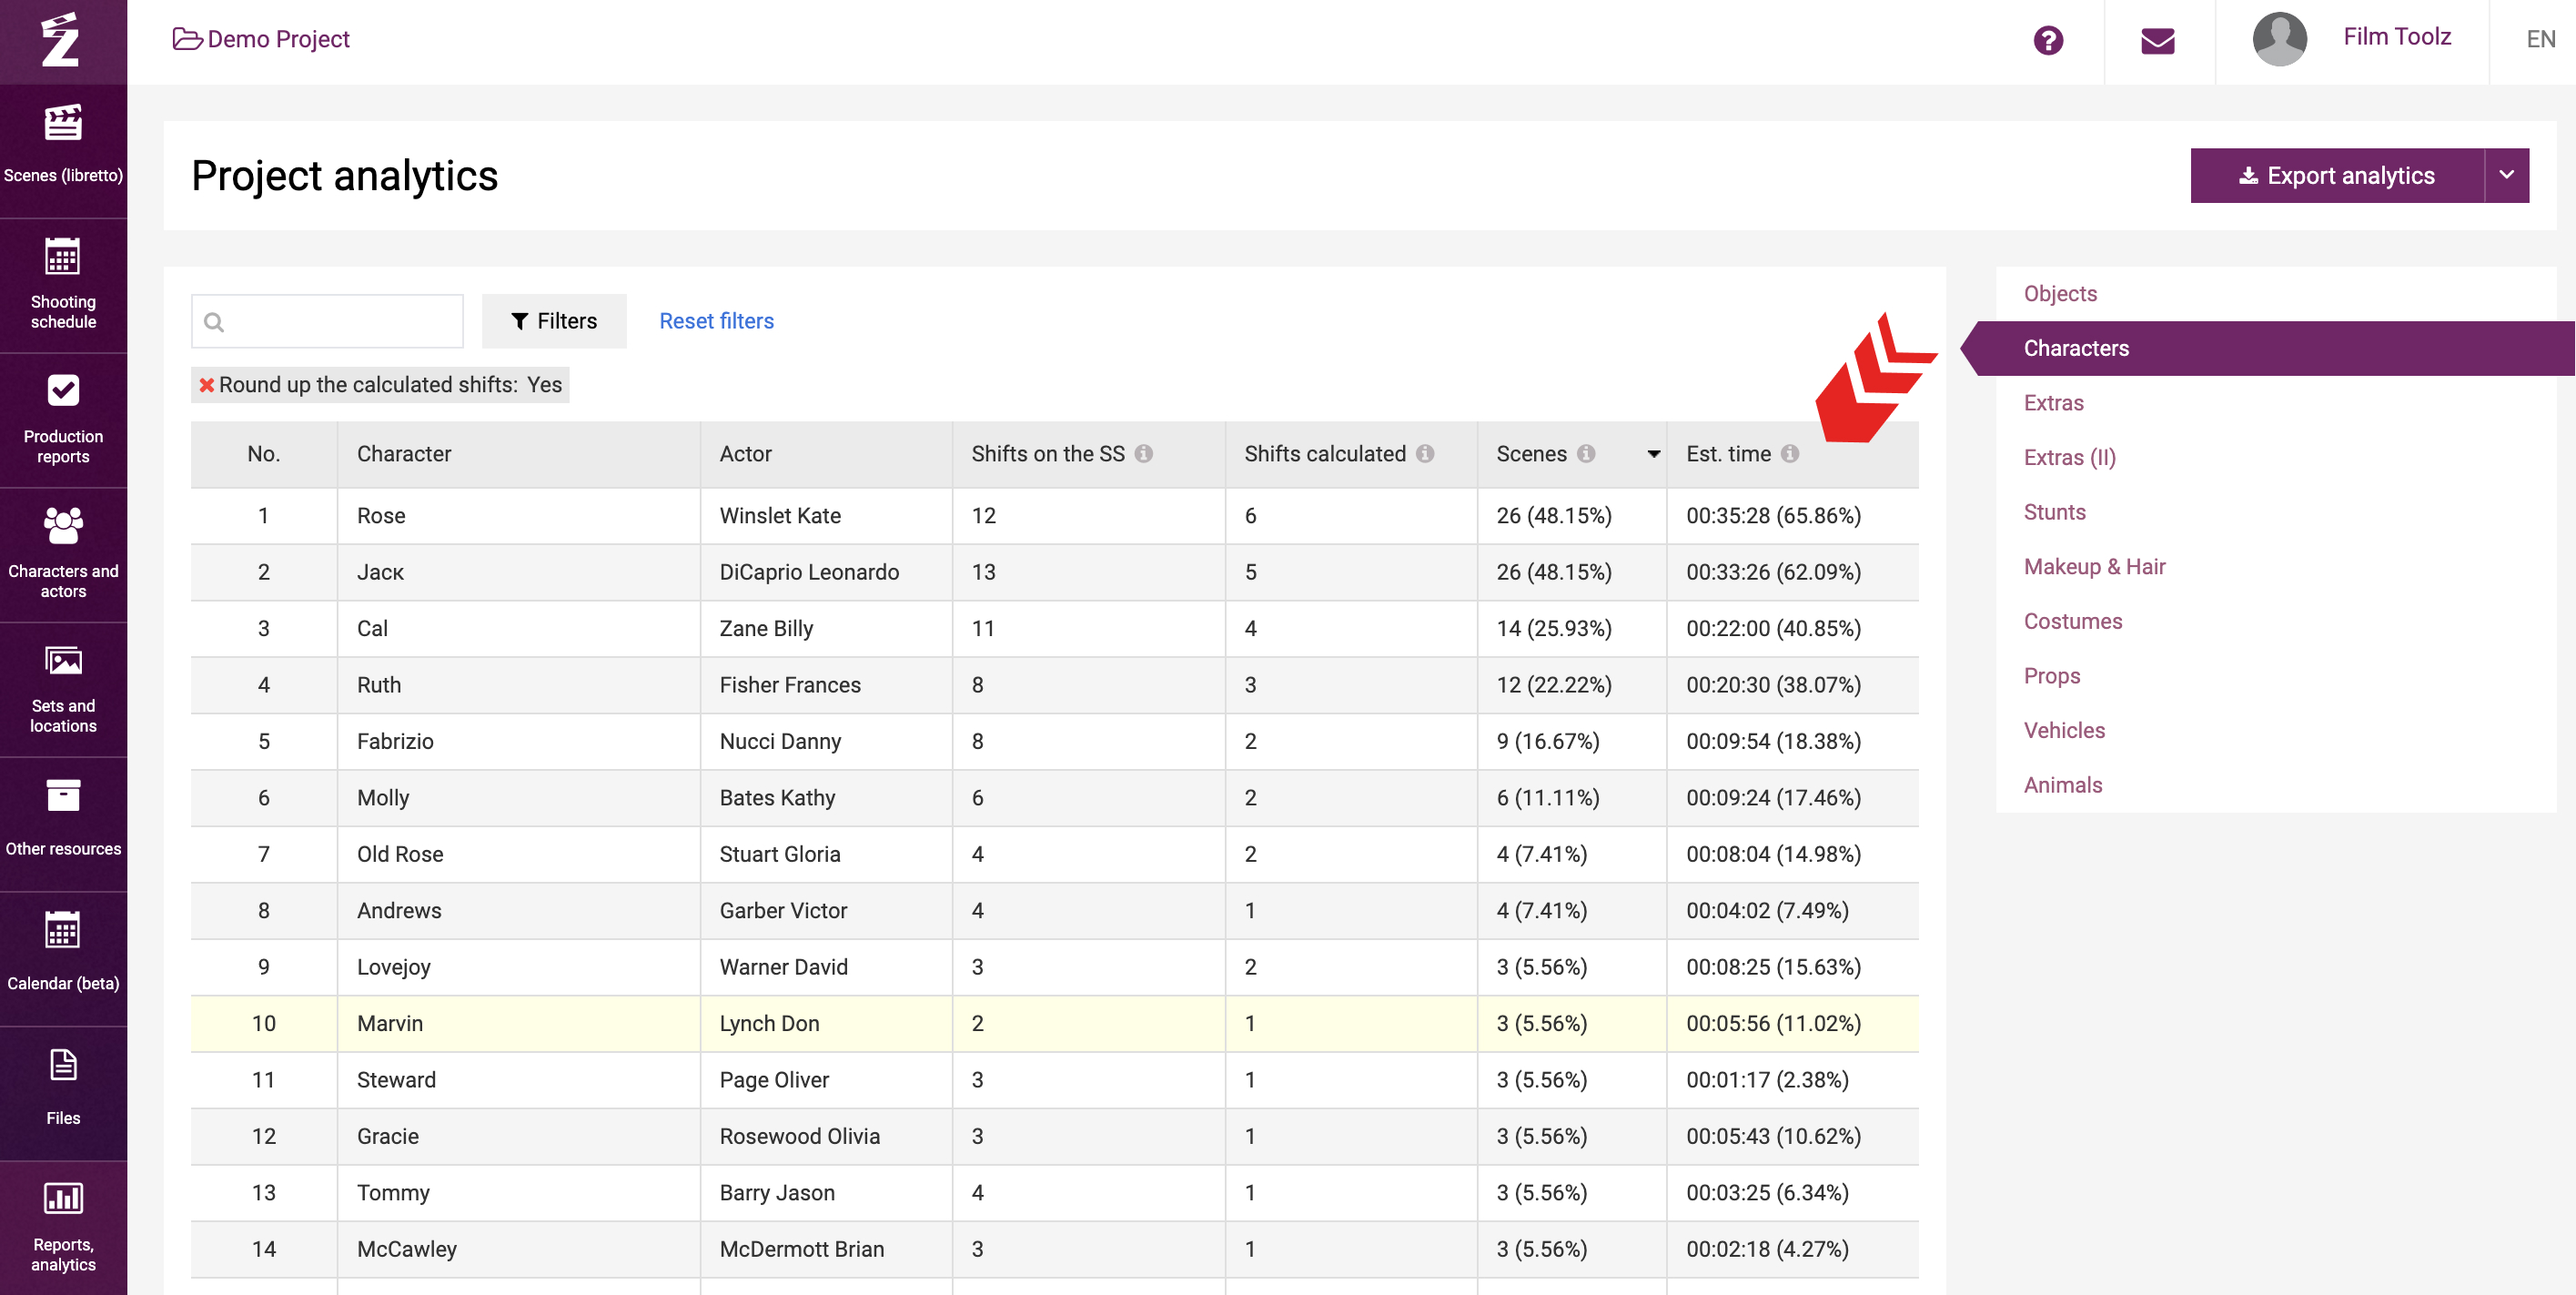
The column “Est. time” to the right shows the total estimated screen time of these scenes, and its percentage in the total screen time, accordingly. Actual screen time is not used in analytics.
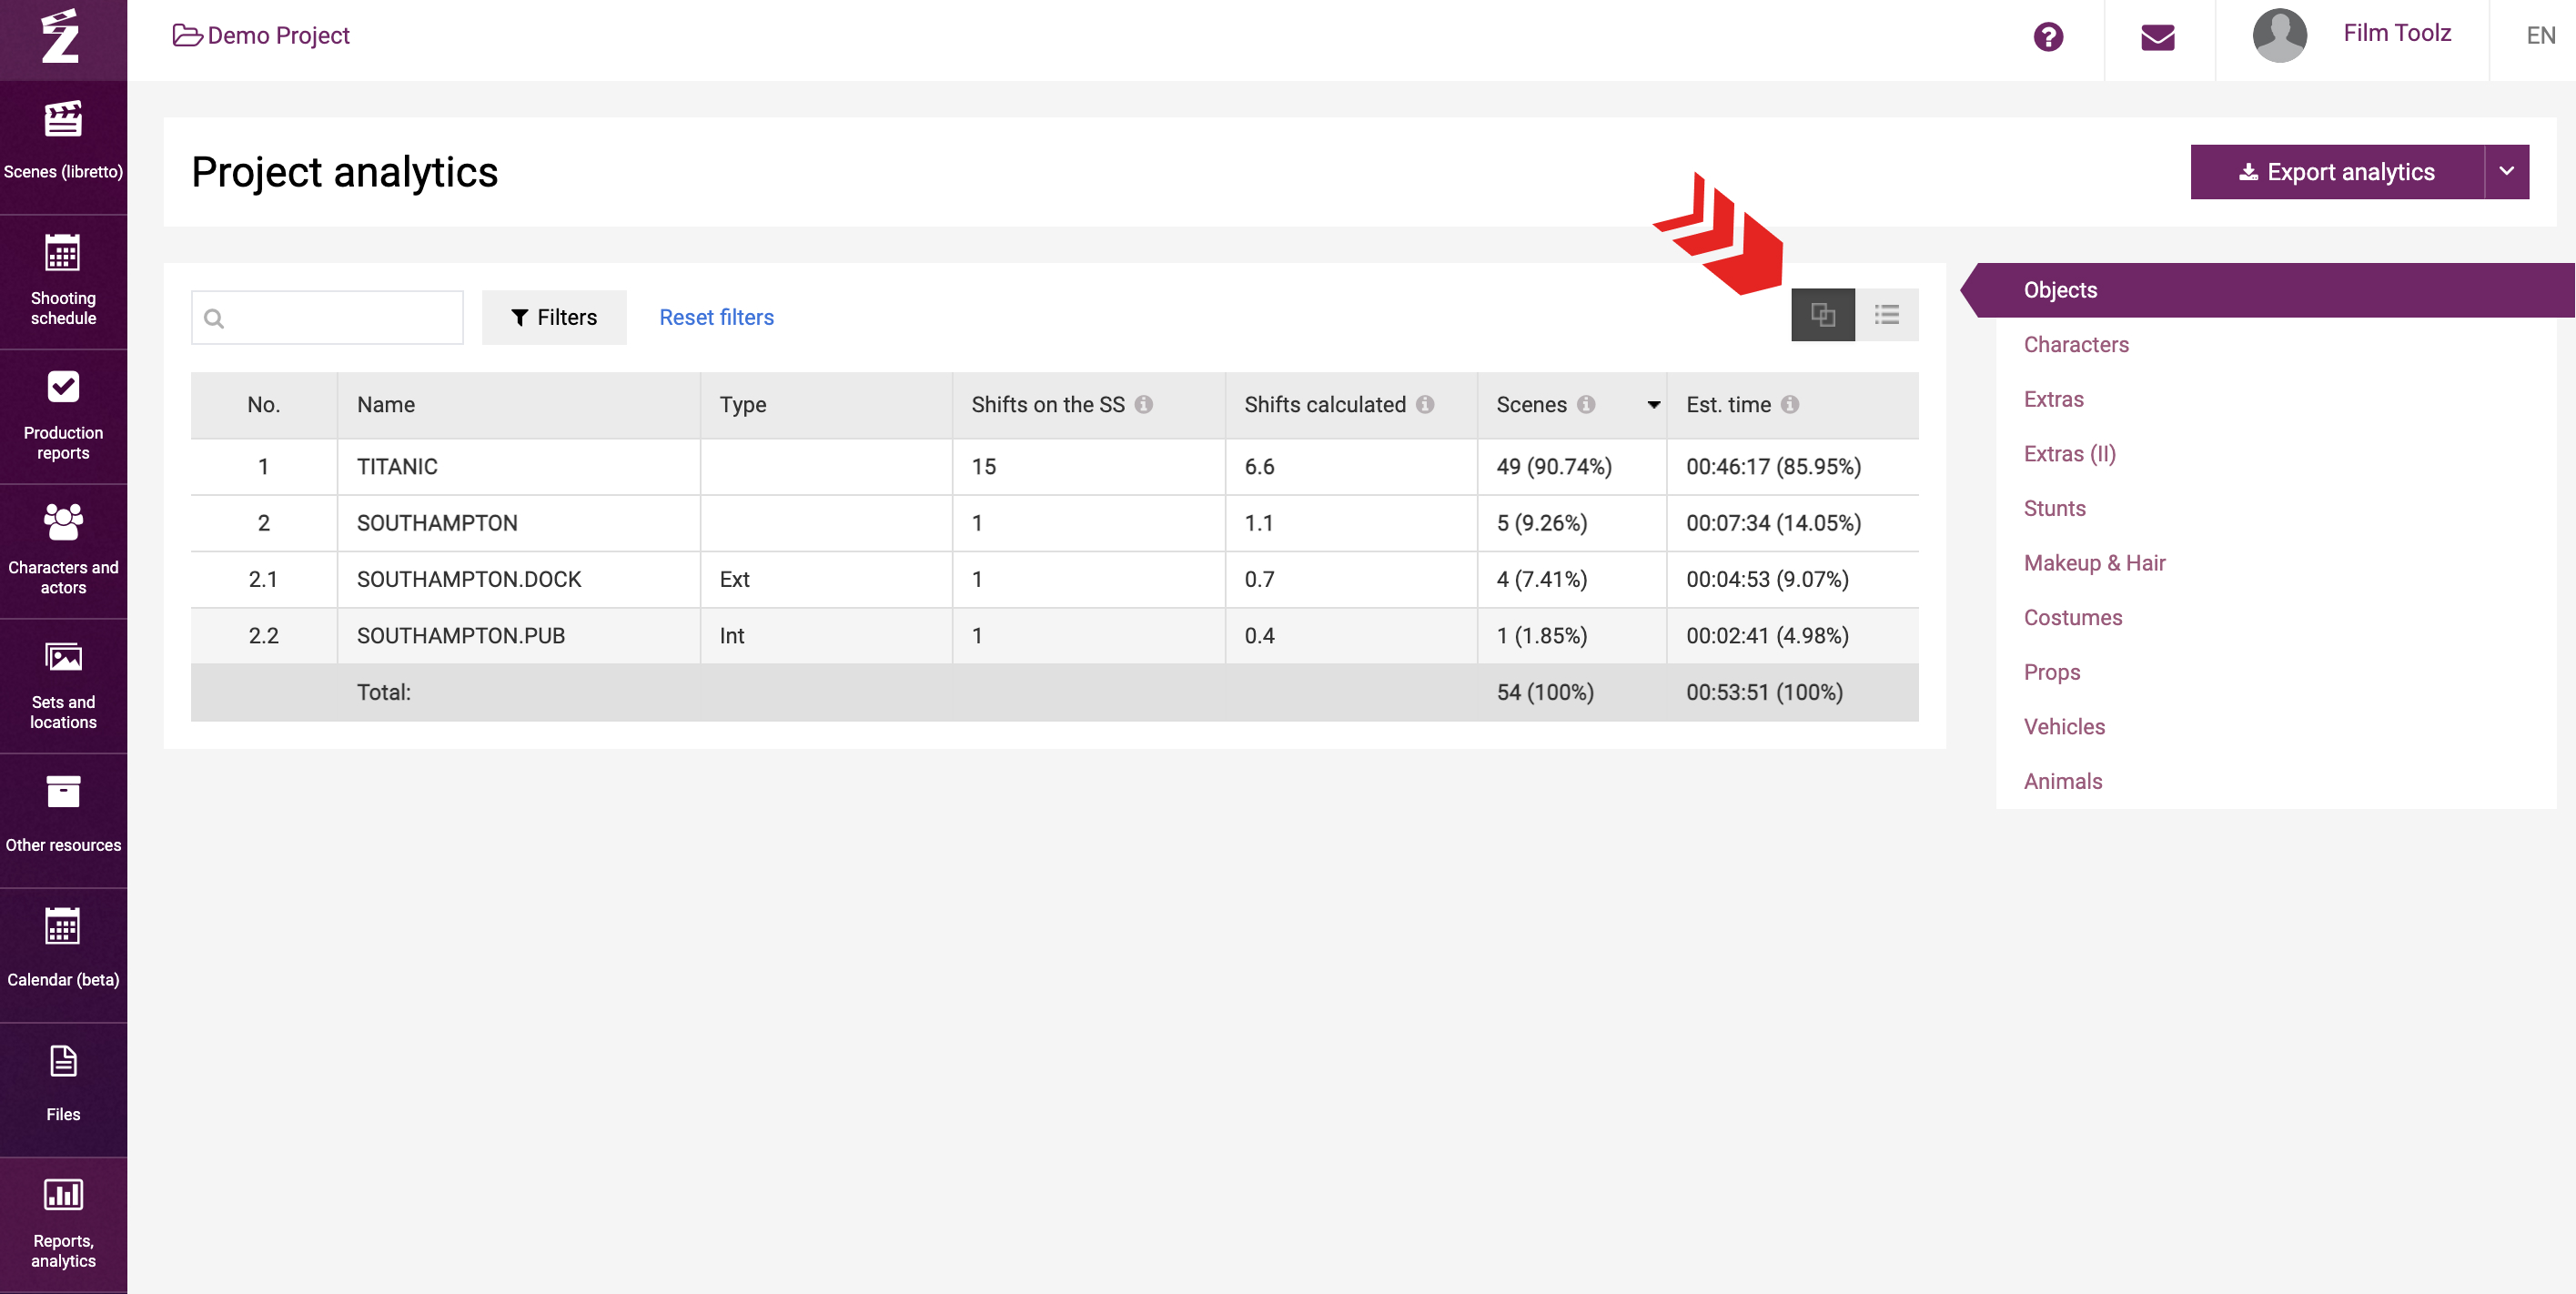
The “Shooting days according to SS” column shows the actual number of shooting days employing this element, set, character according to the shooting schedule built in the system. Please note that a shoot of a single element by two units on a single day will be treated by the system as a single shooting day in the analytics.
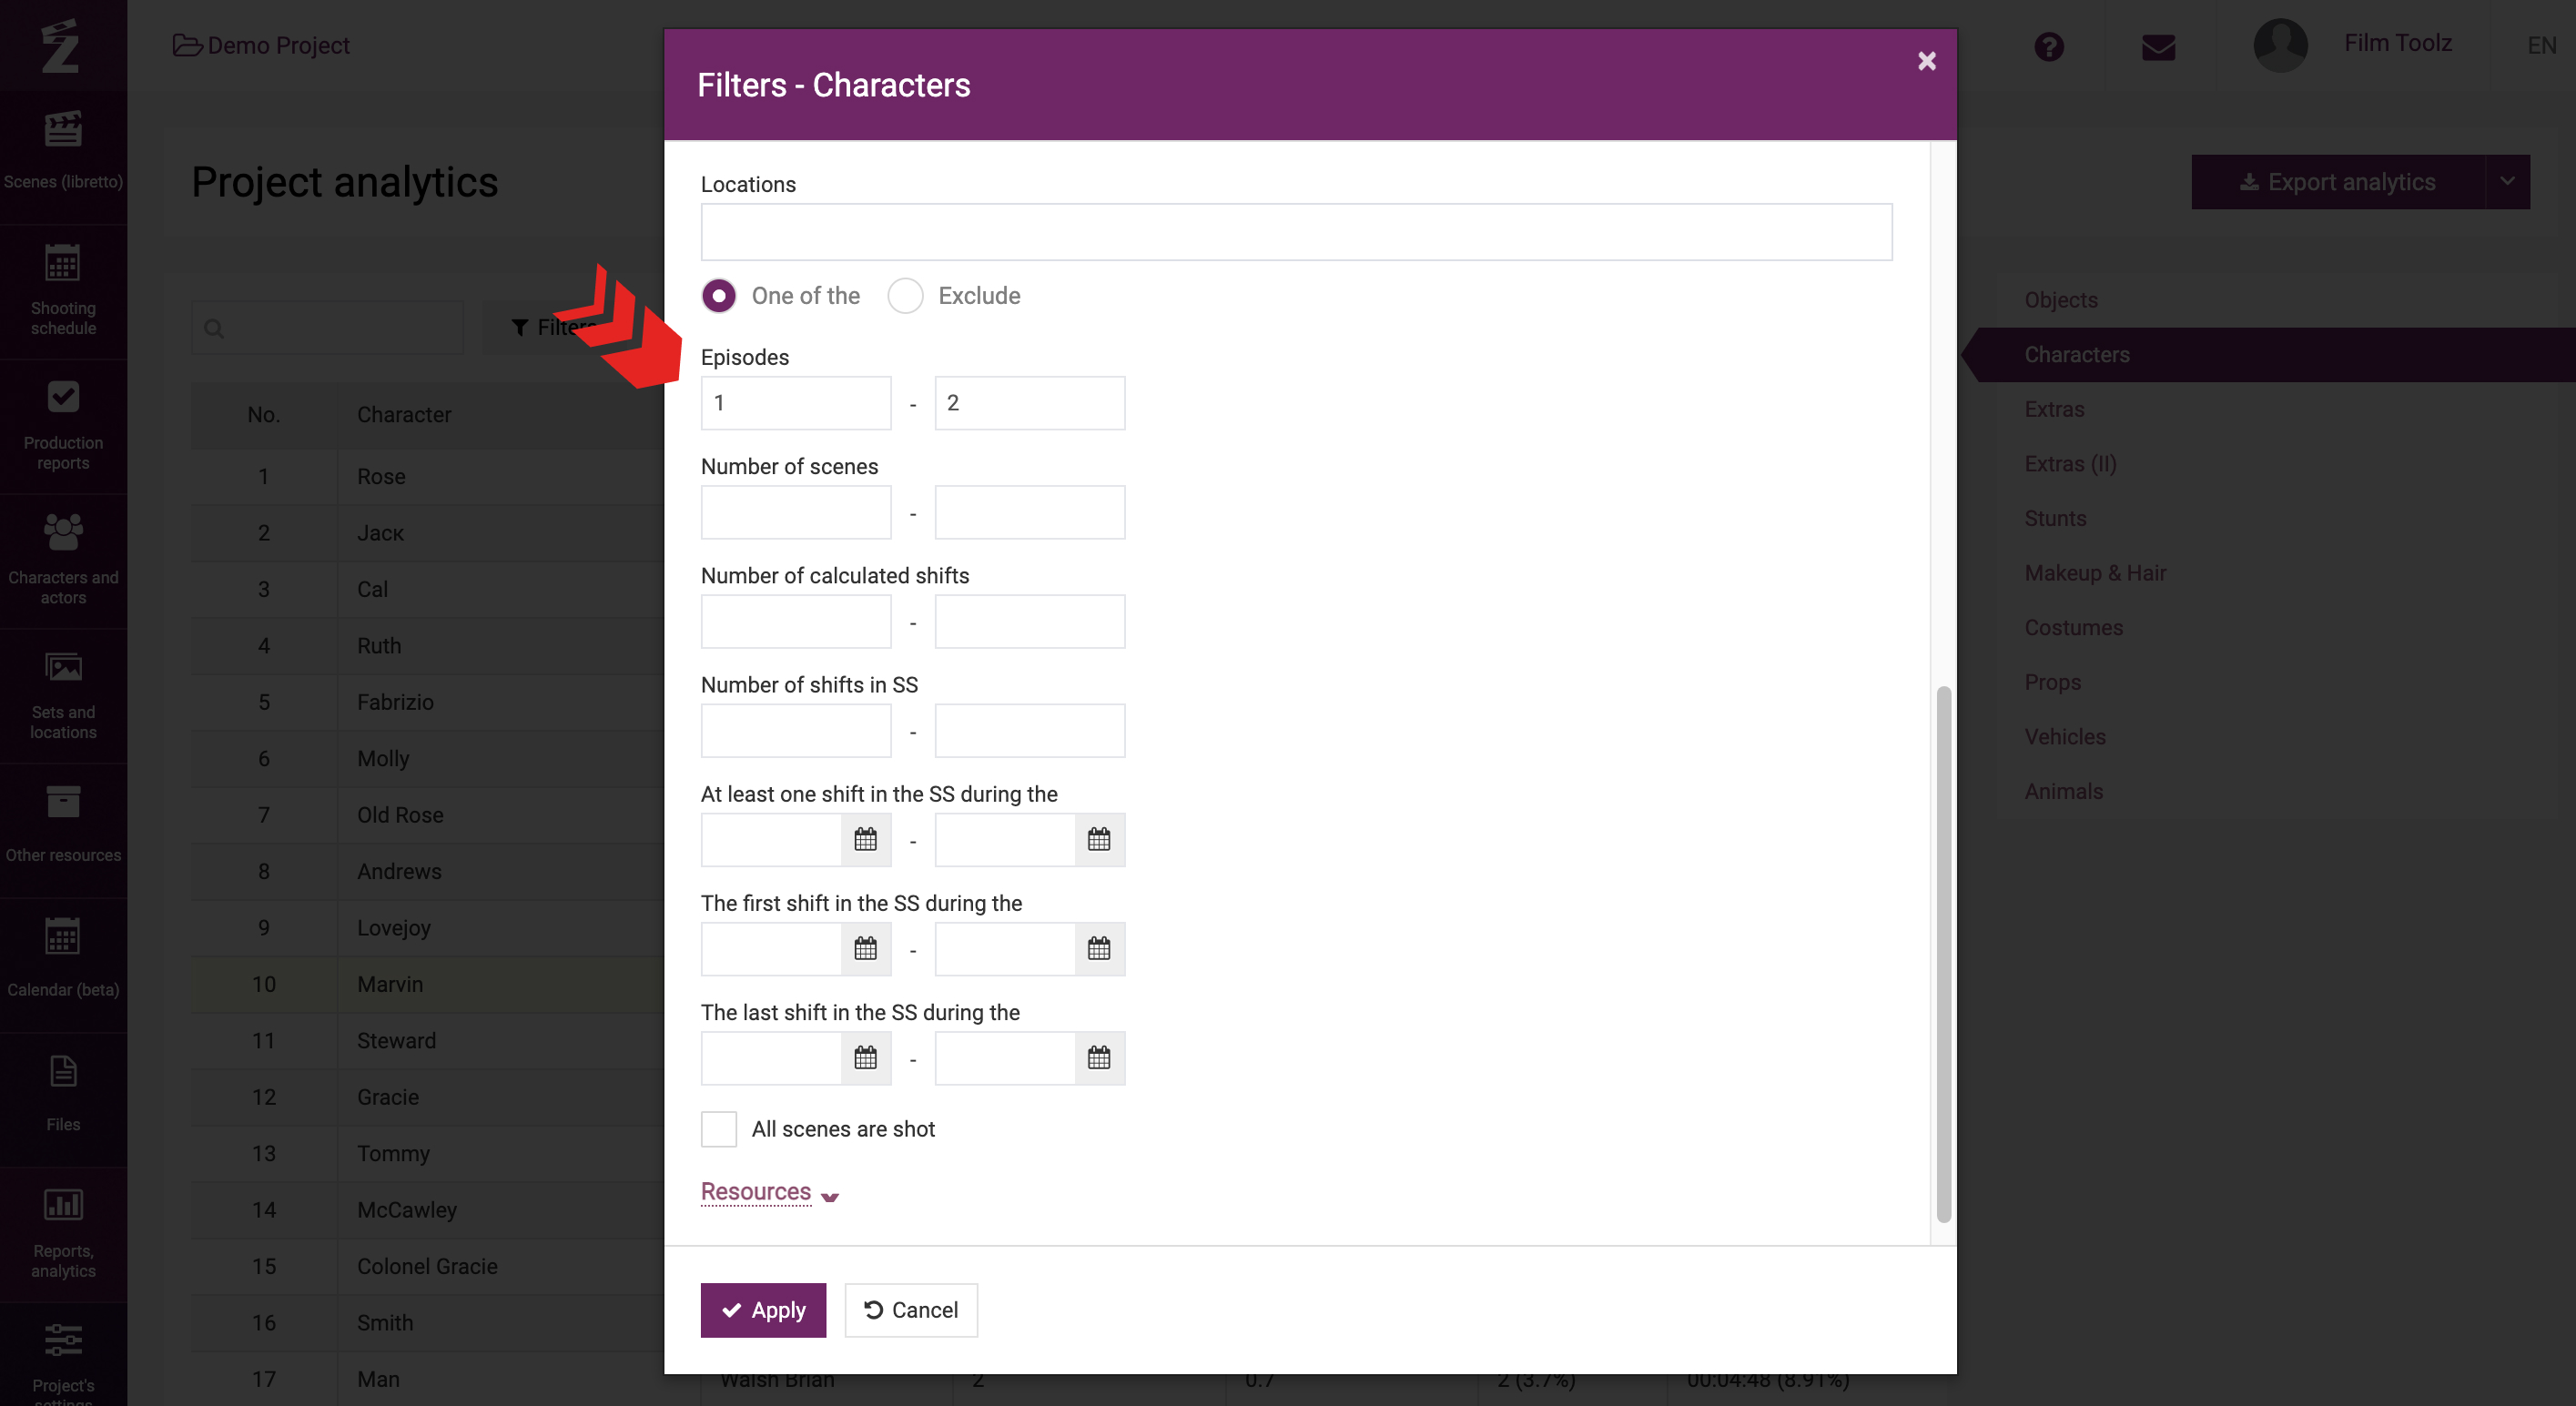
You can configure the view of the data shown in the report by using the filter by episodes to obtain the analytics for the selected range of episodes.
Sets may also be grouped by the name of the set. To enable the grouping, click on the respective icon above the table. If you use grouping, the system will display groups of sets that will include all sub-sets relating thereto. If you use this view, you will be able to see the information about the group as a whole, and if you choose to use the itemised view, you will see the information about each sub-set individually.
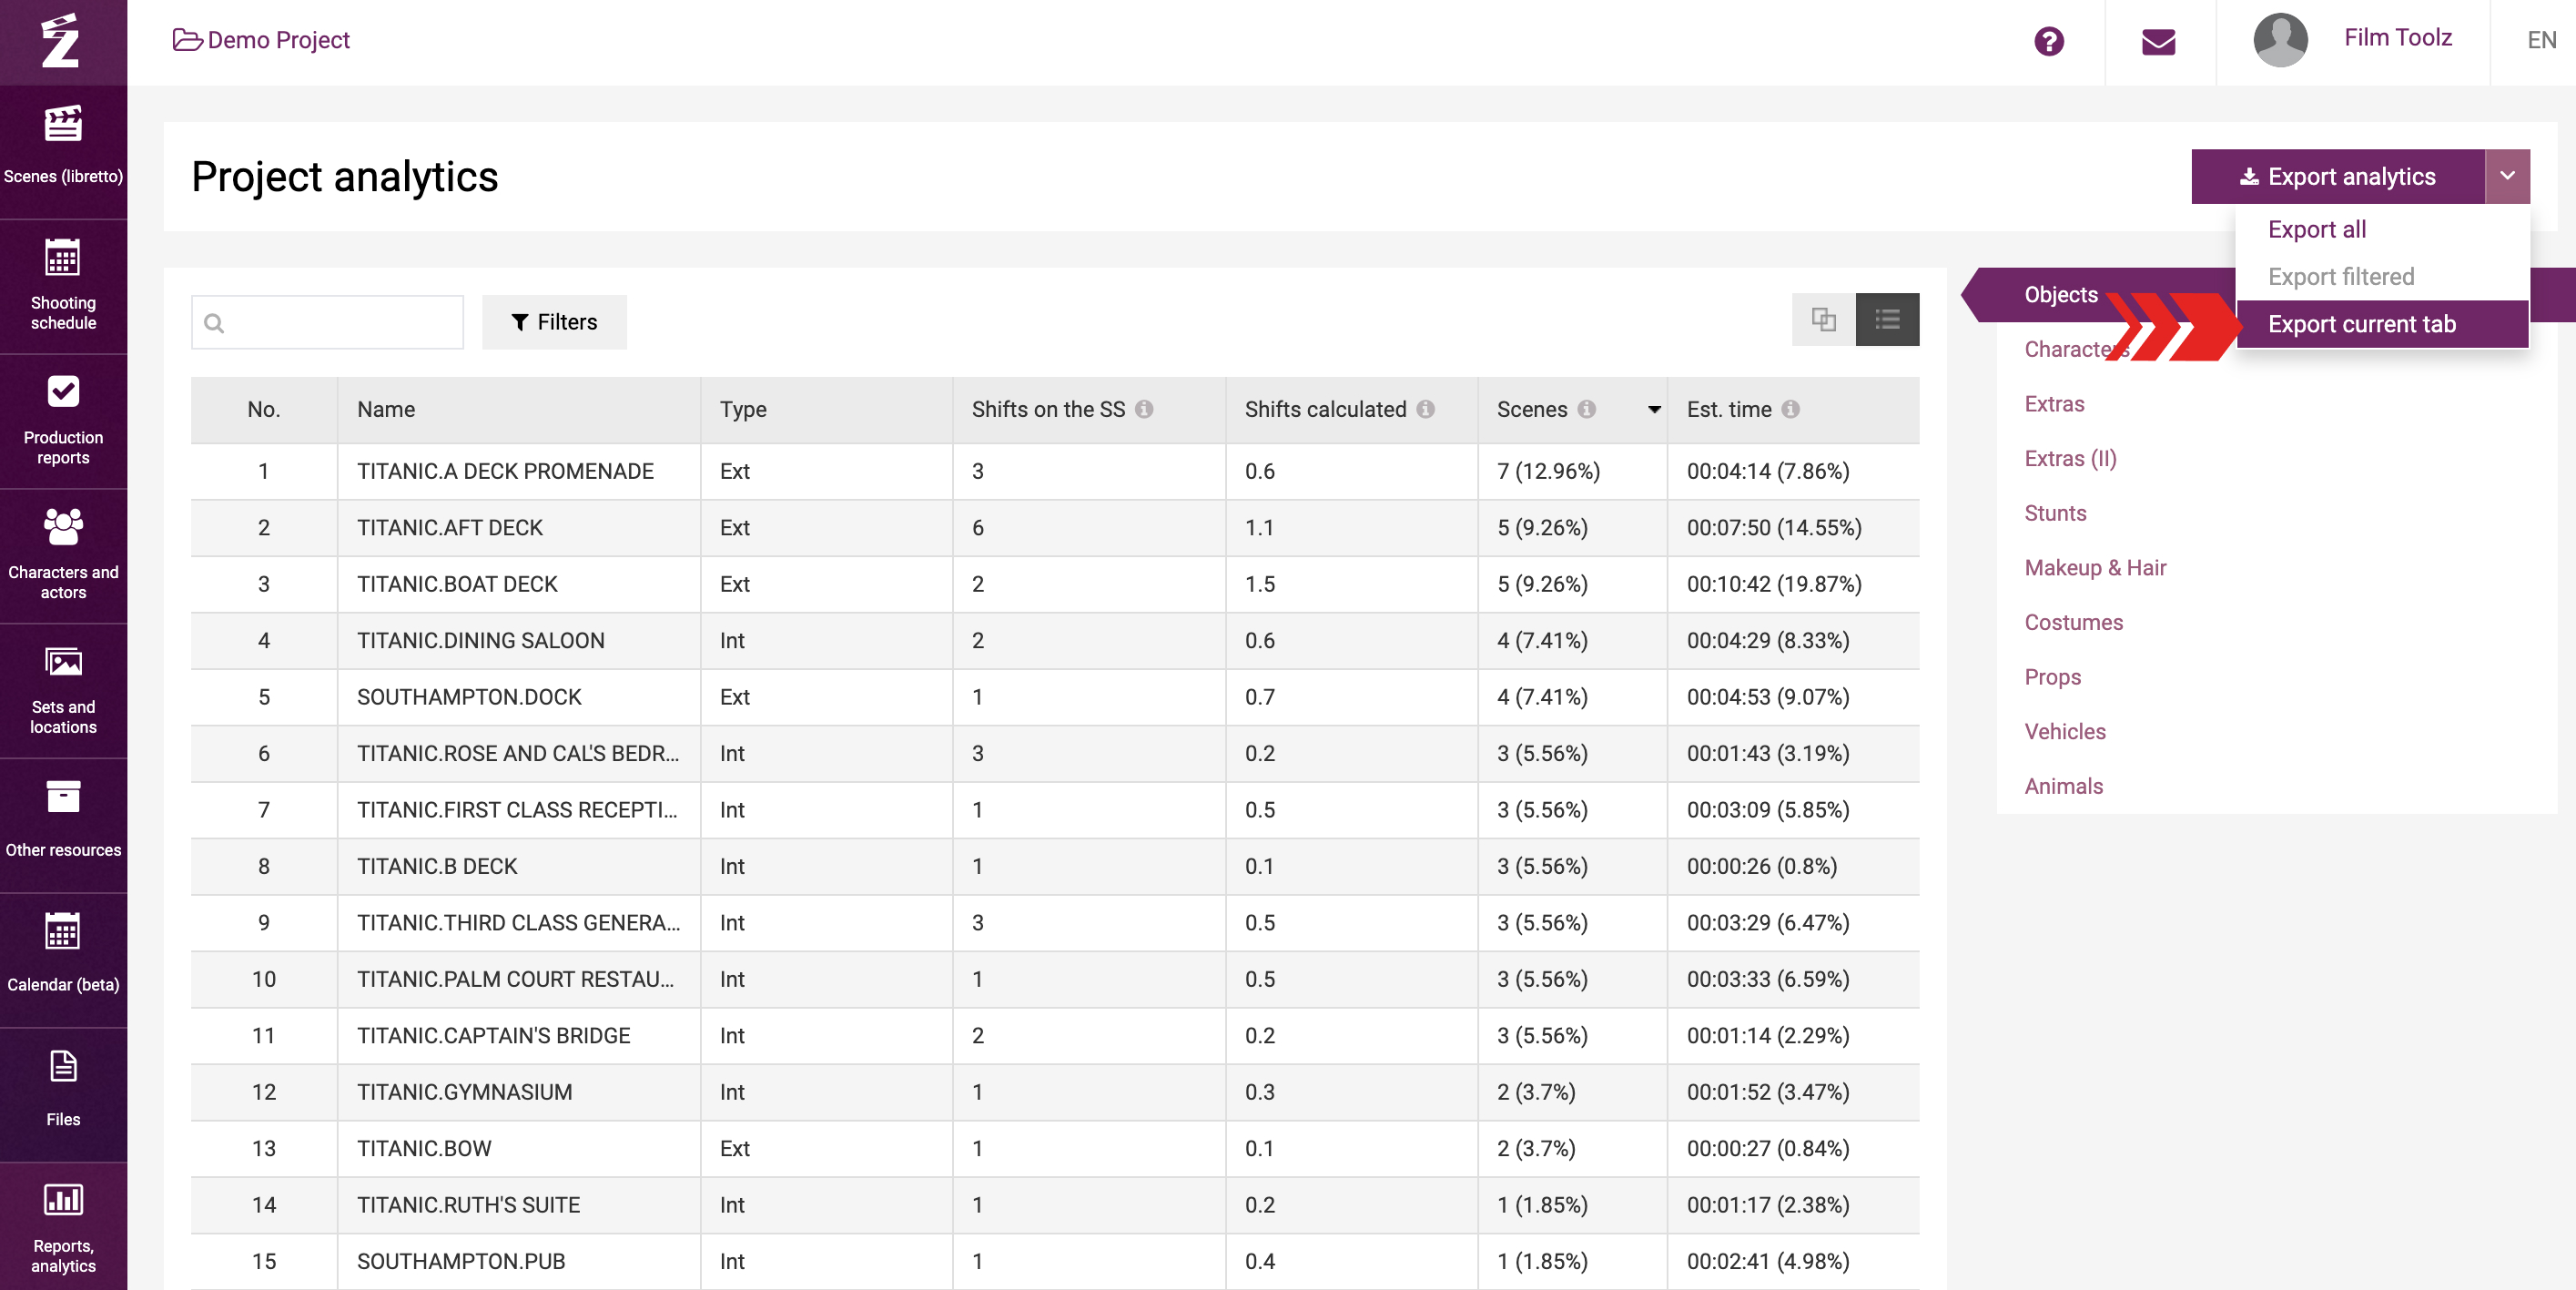
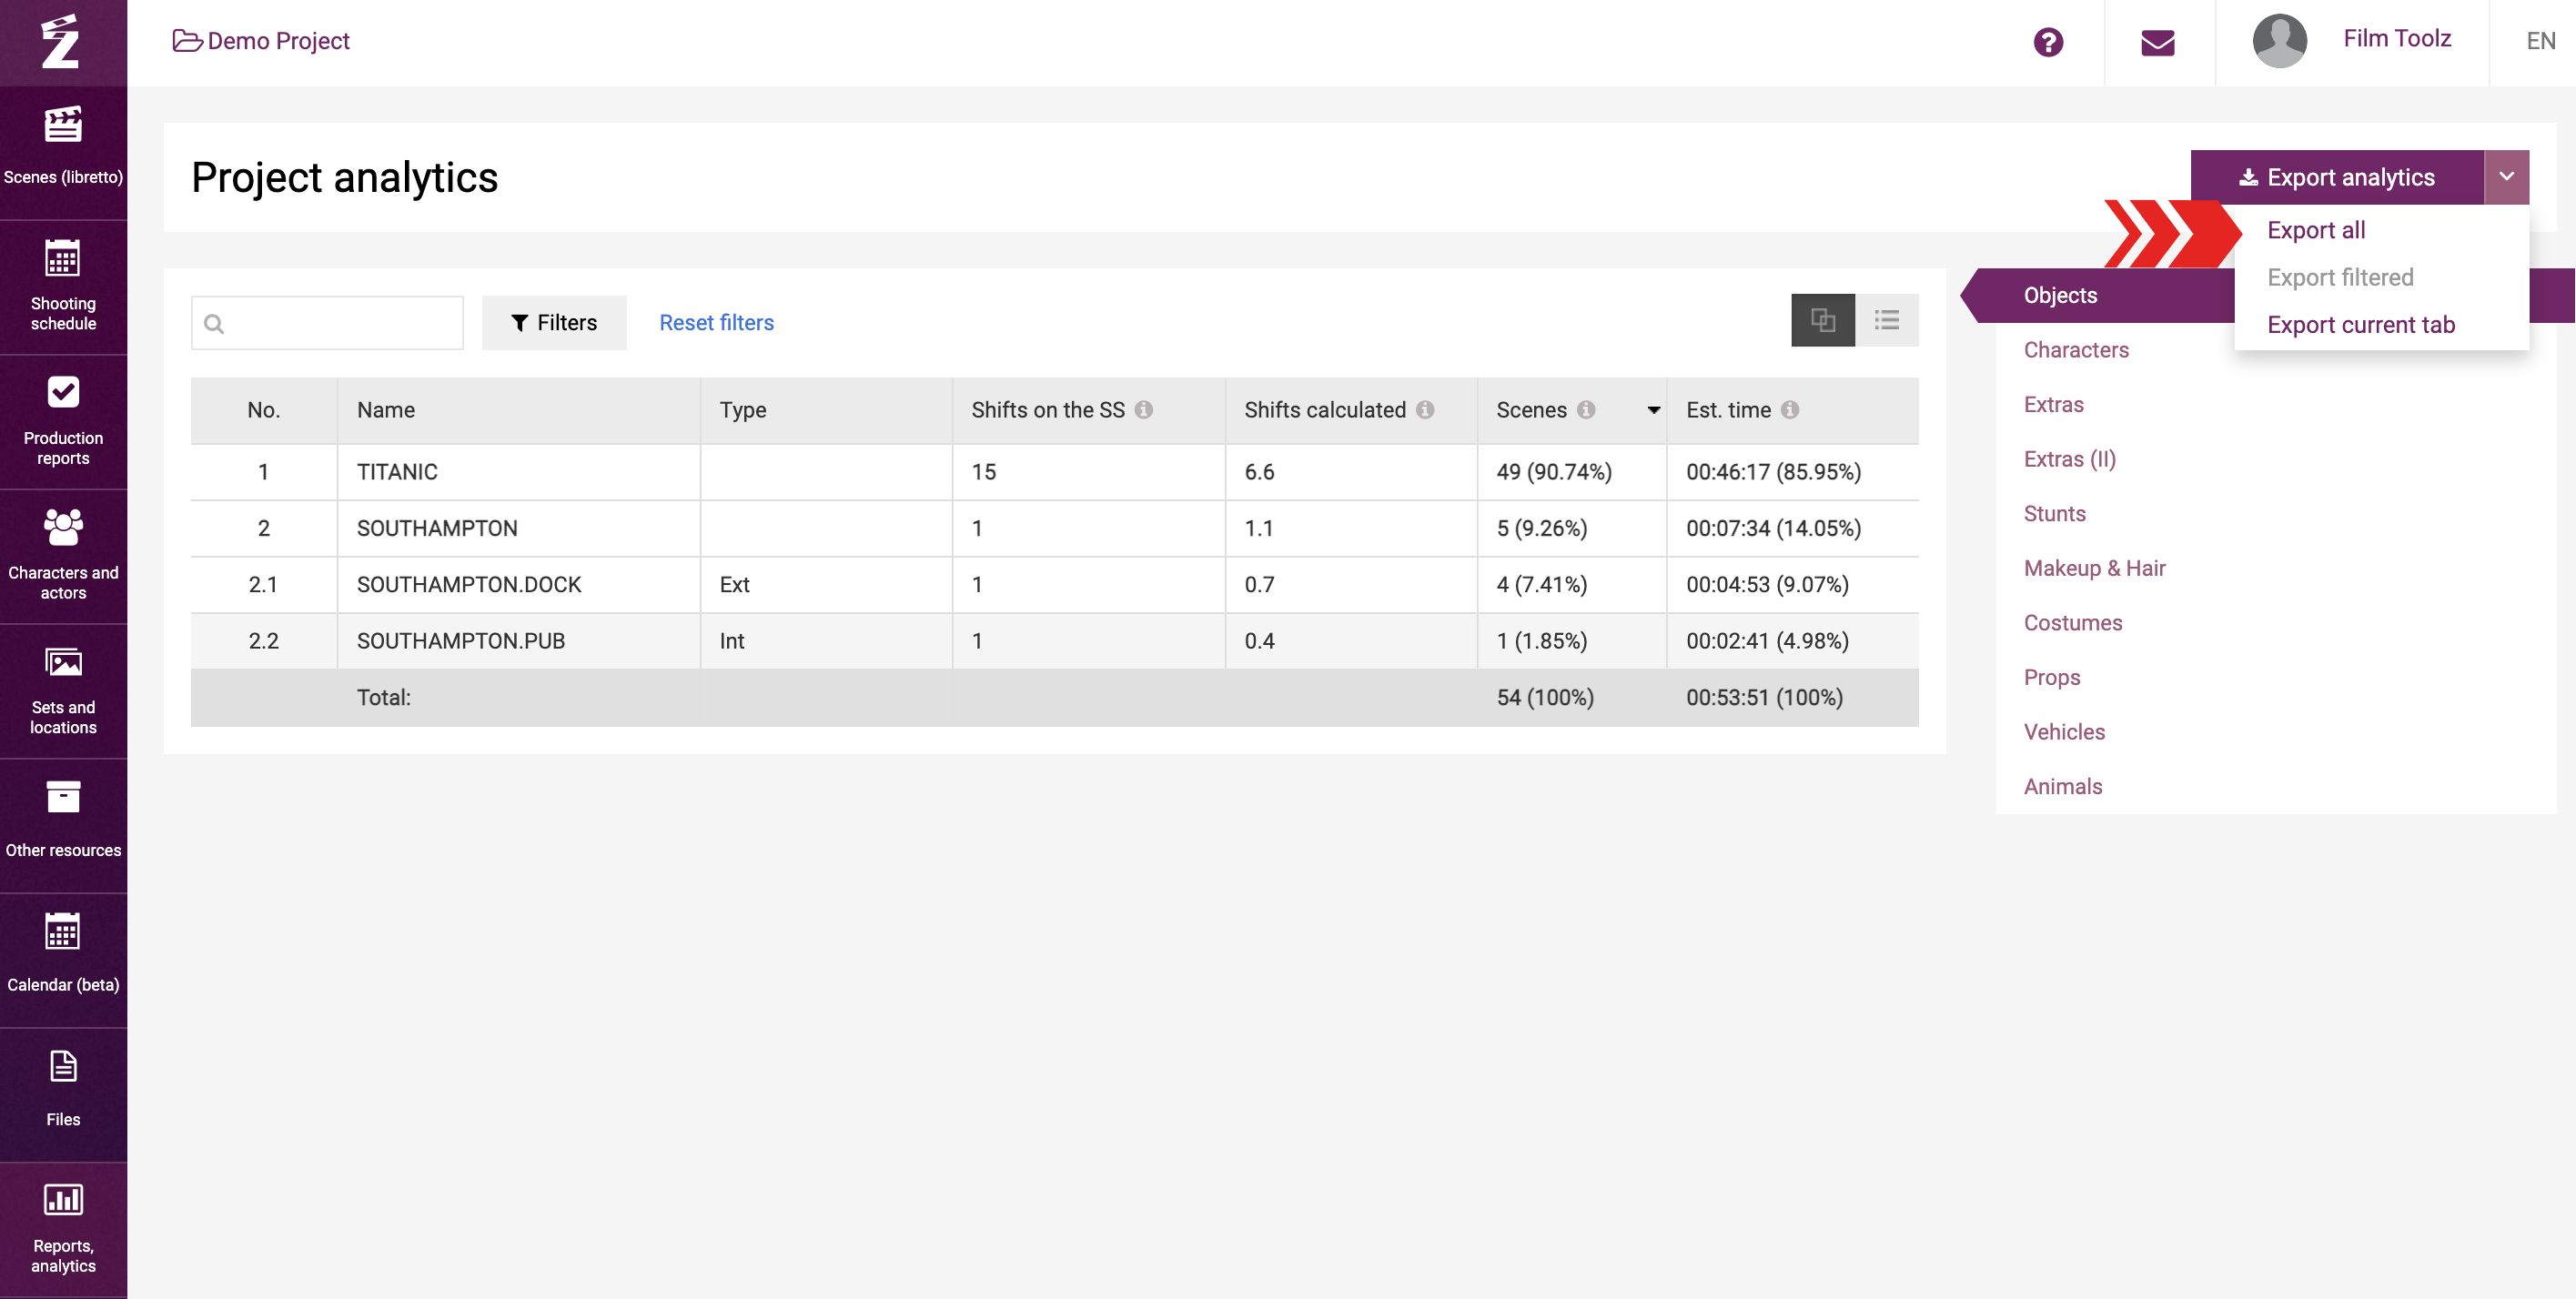
If necessary, you can export the analytics, whether in whole or filtered by your preferred parameters. If you click on “Export analytics”, you will export the workbook in Excel format, with each spreadsheet containing information on one element category.
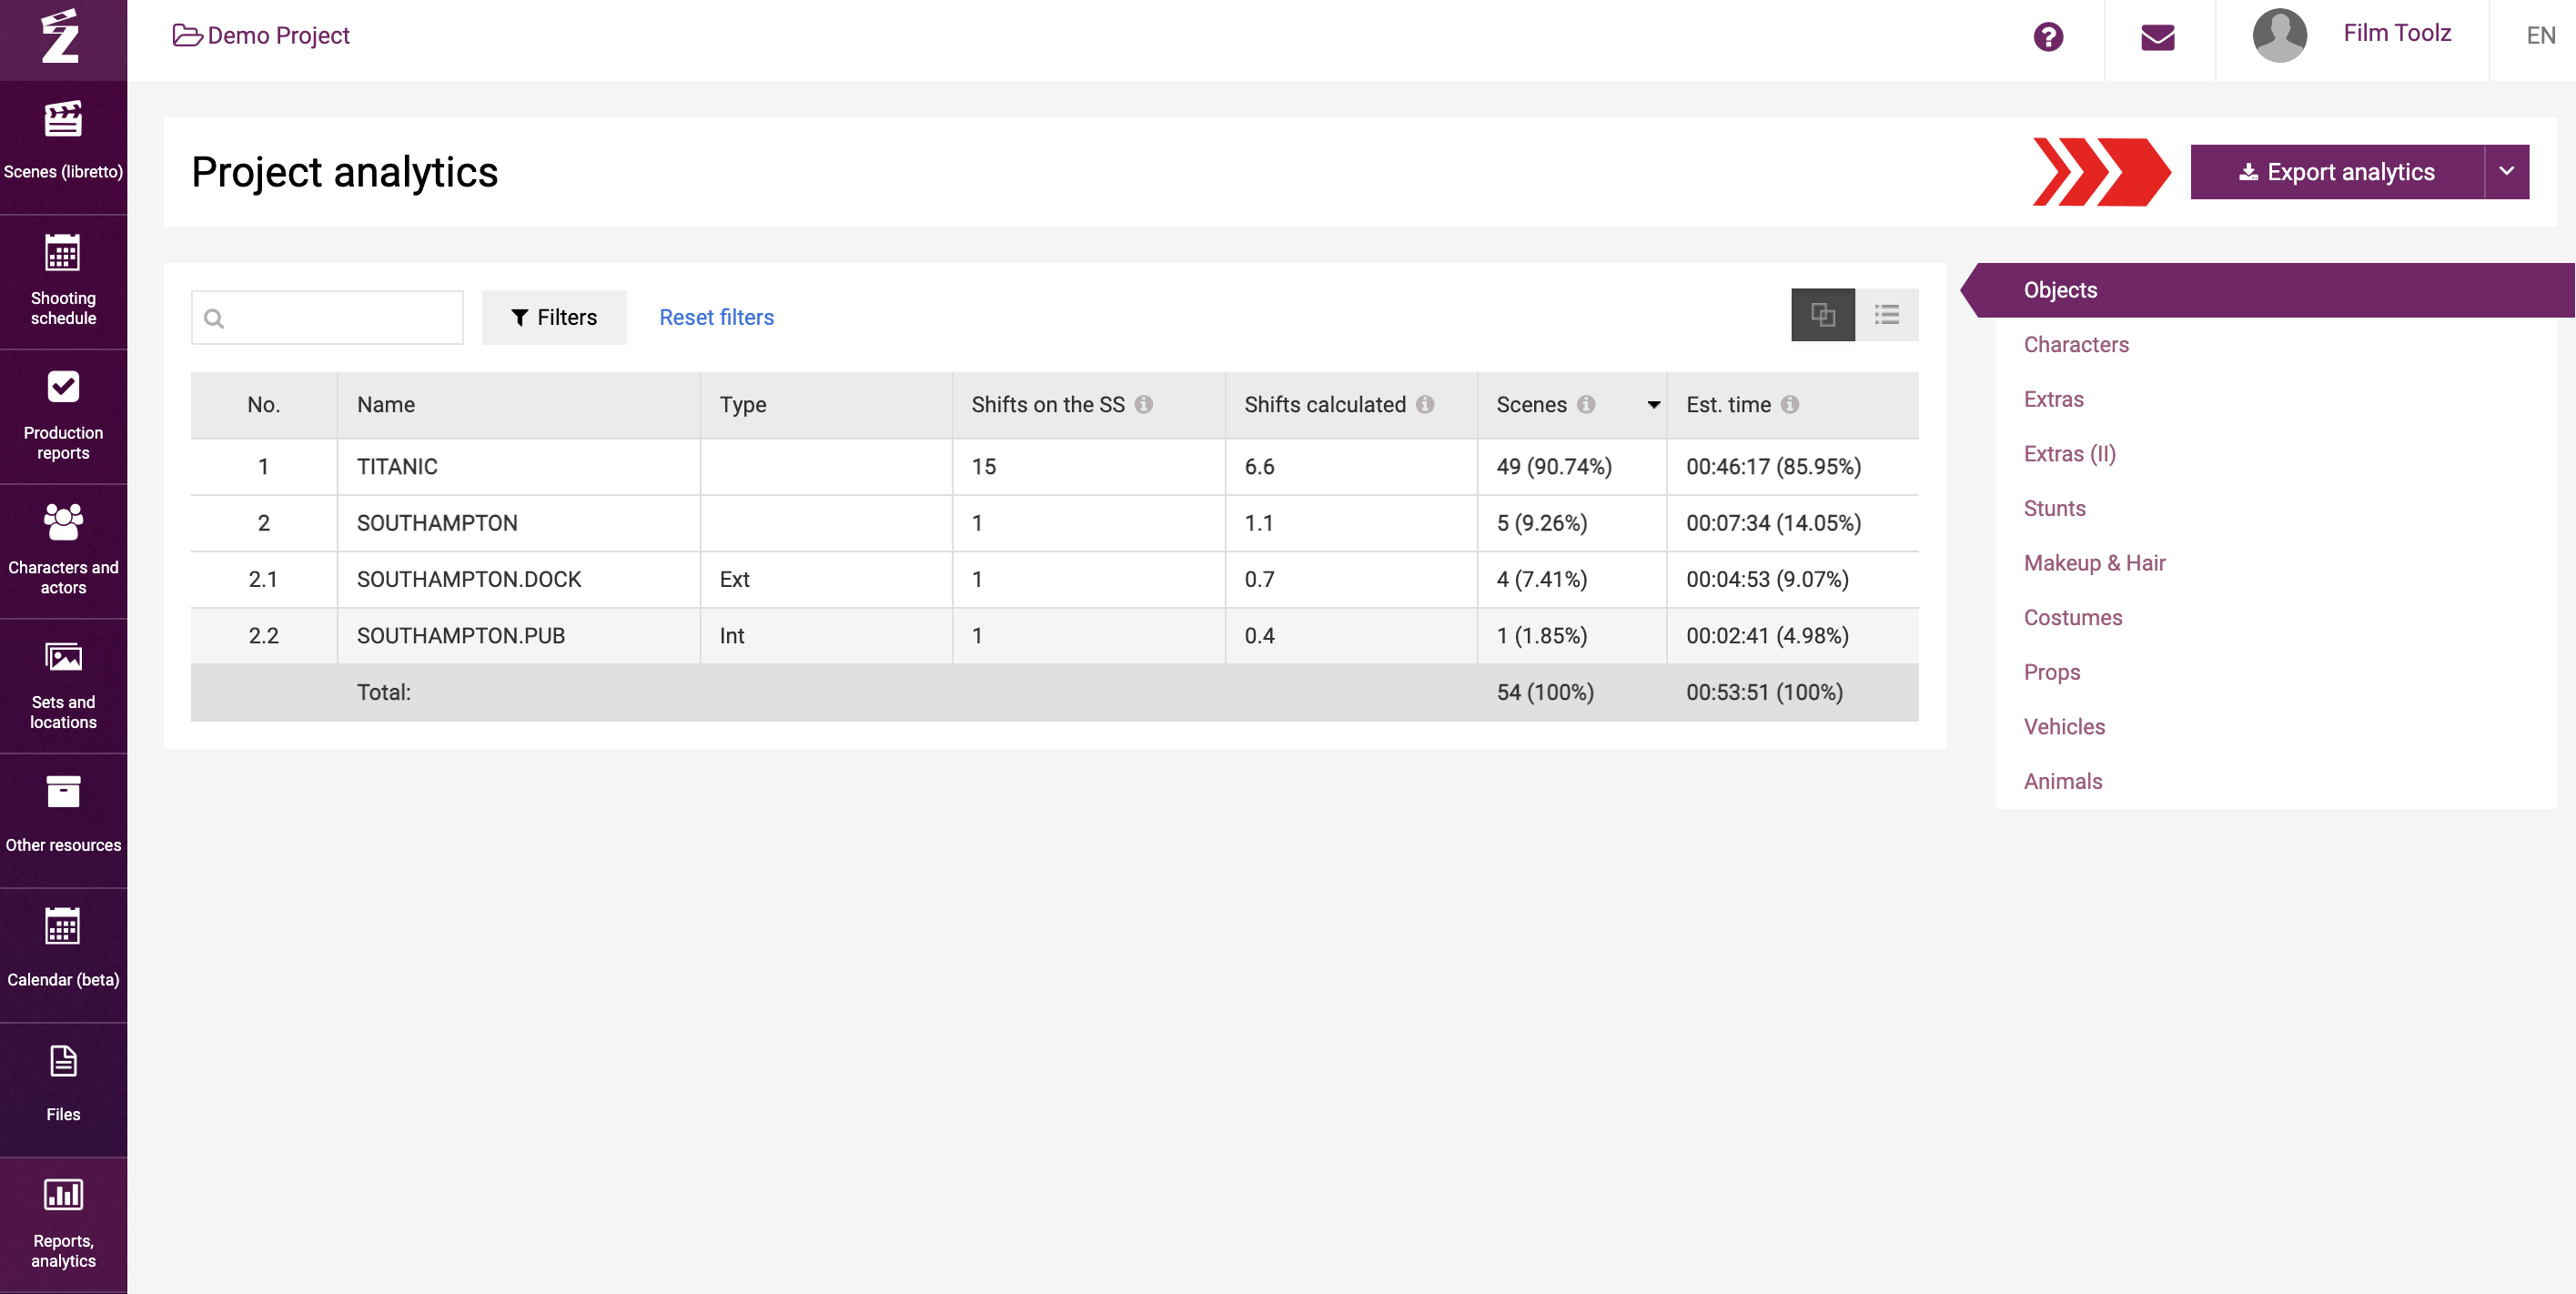
You can also export the analytics in the same format by selecting “Export all” in the drop-down list next to the “Export analytics” button.
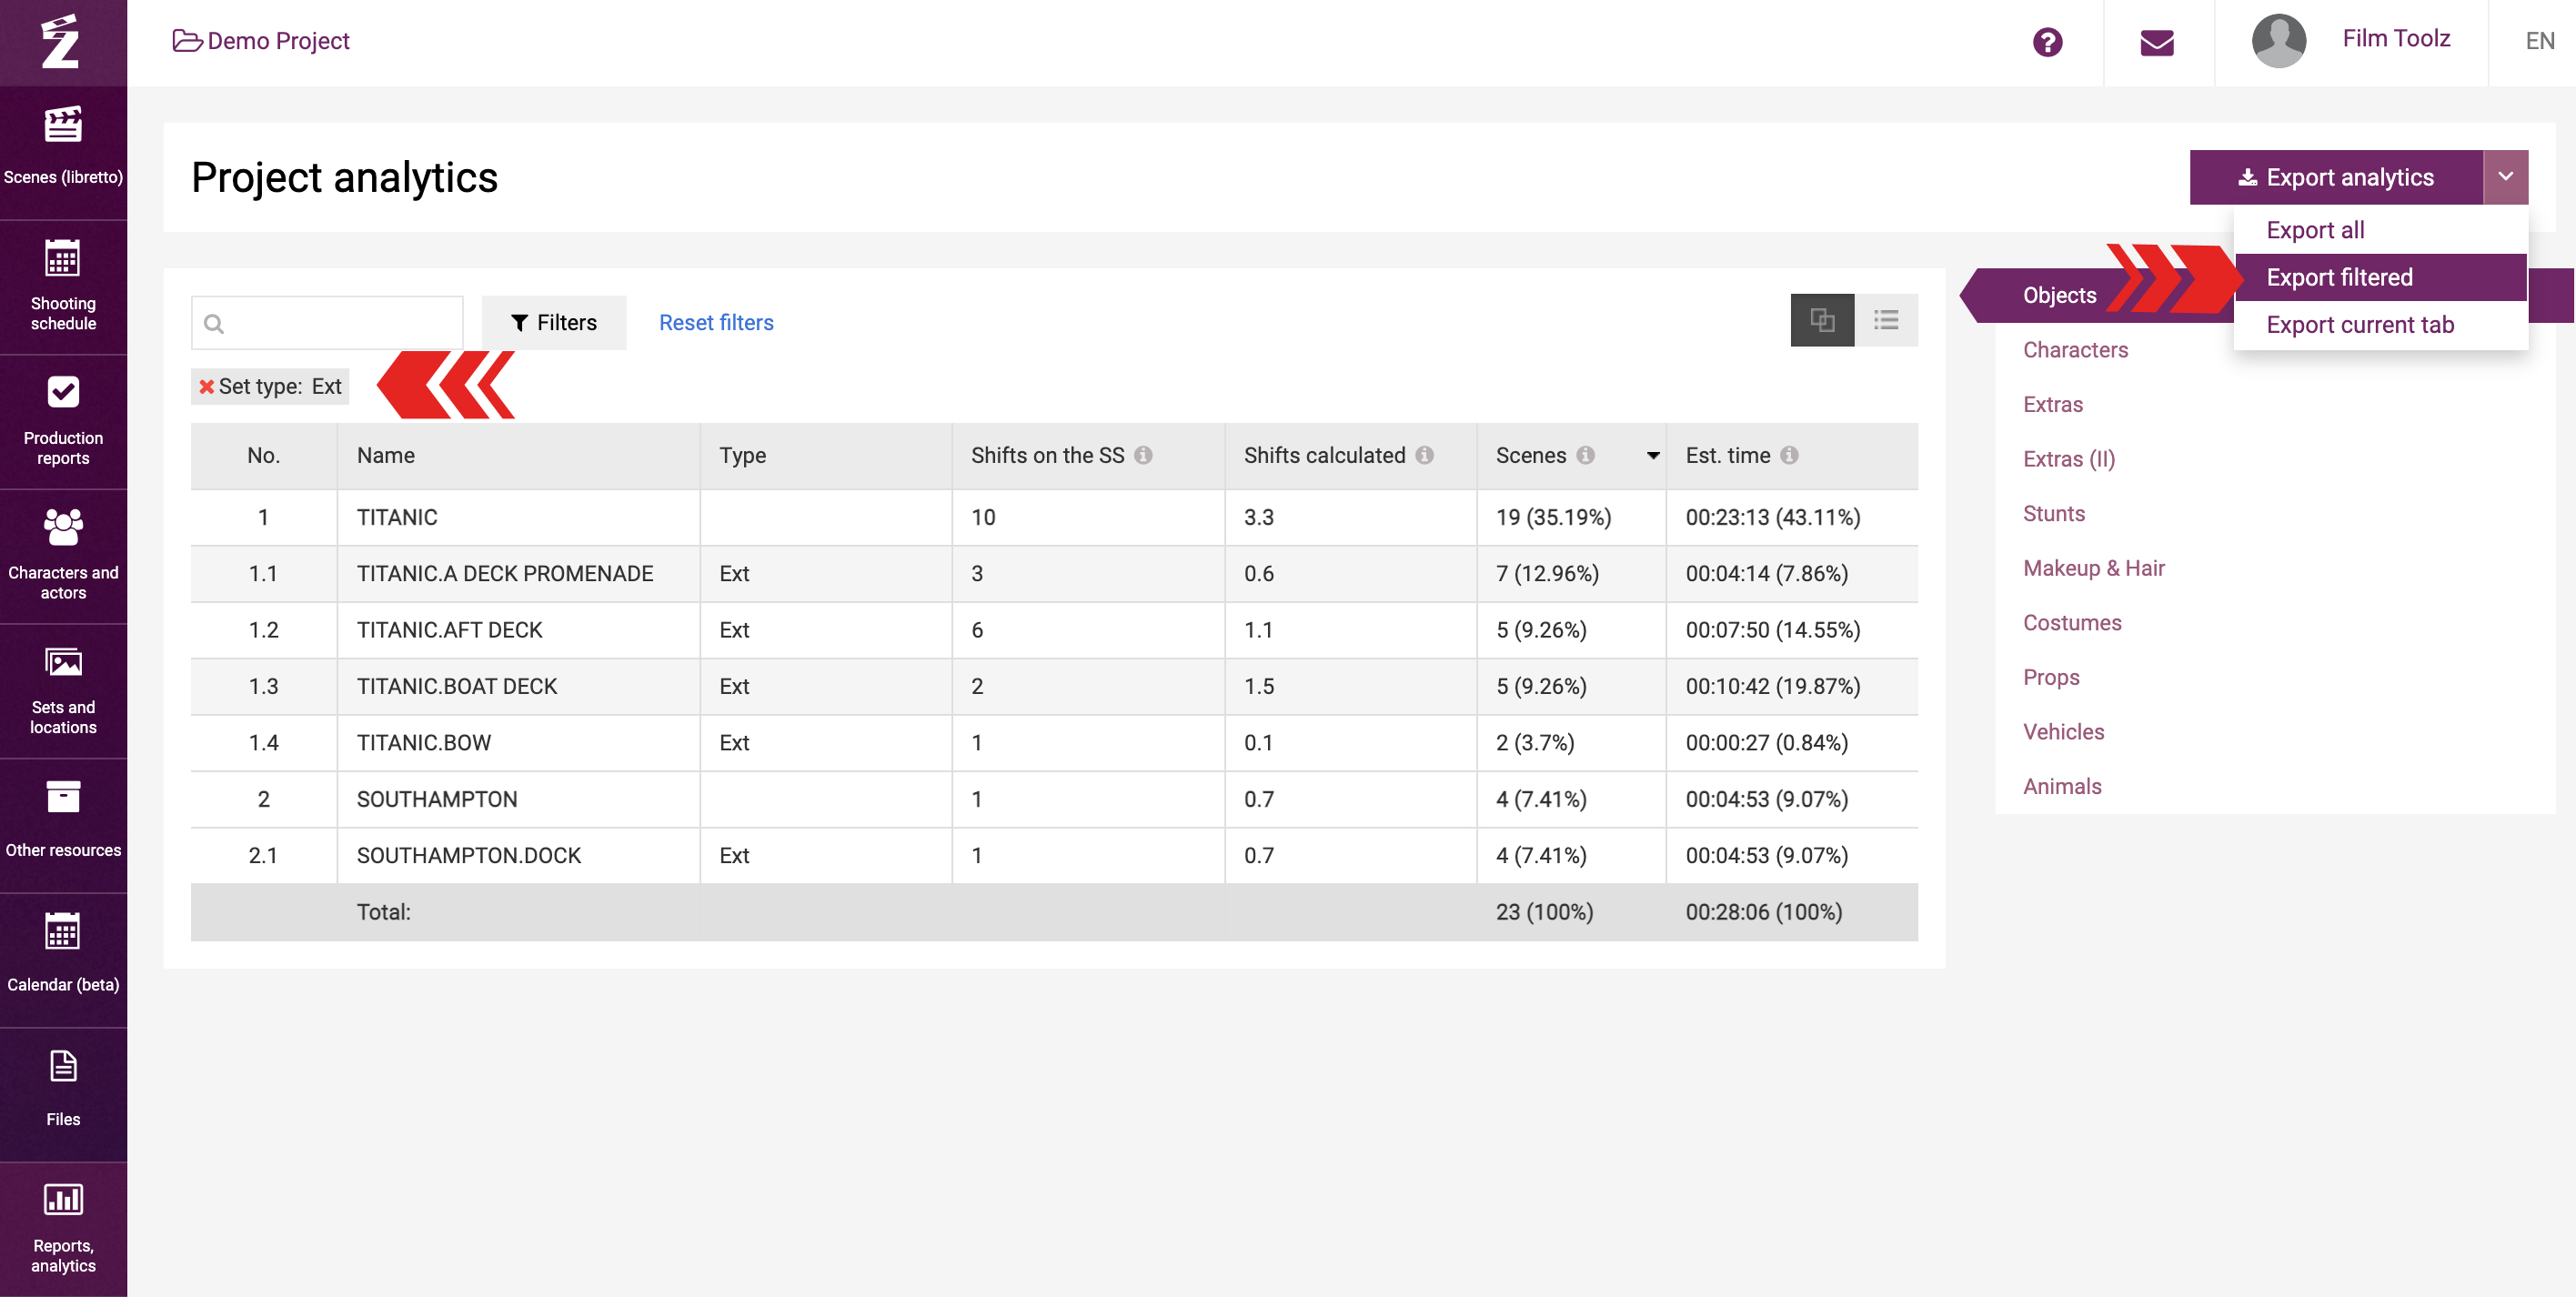
To export the analytics using your preferred filters, click on “Export filtered”. Should this option be disabled, use at least one filter in the report.
If you need to export a report for sets only, for a specific element or characters only, use the option of exporting the current tab.